Predicting patient who is at risk of developing Hypertension or Diabetic using Shiny4Python
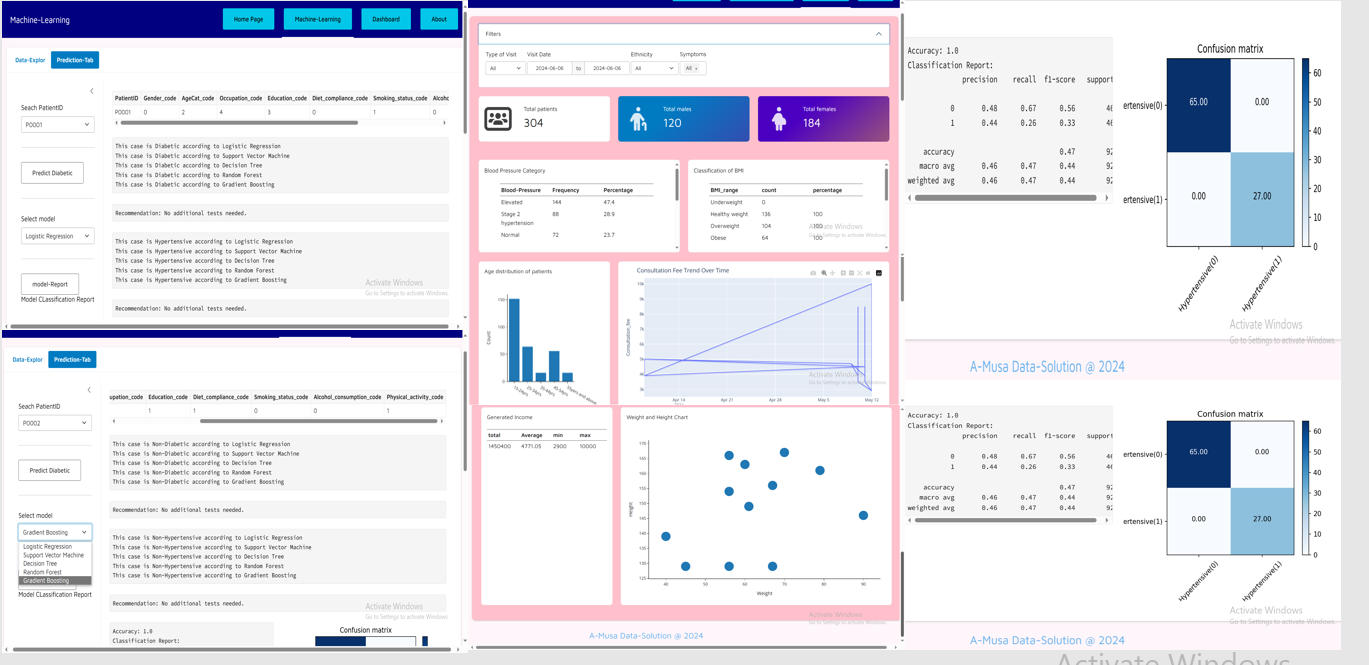 This is a Machine learning/Artificial intelligence EHR Software I built using Shiny for Python to help physicians predict each patient who is at risk of developing Hypertension or Diabetes using various machine learning models in a resource-limited setting. The app leverages supervised machine learning models to predict whether a patient is at risk of developing hypertension or diabetes. The app includes a variety of machine learning models and statistical techniques for data exploration, providing valuable insights for healthcare professionals.
The use of this software includes:
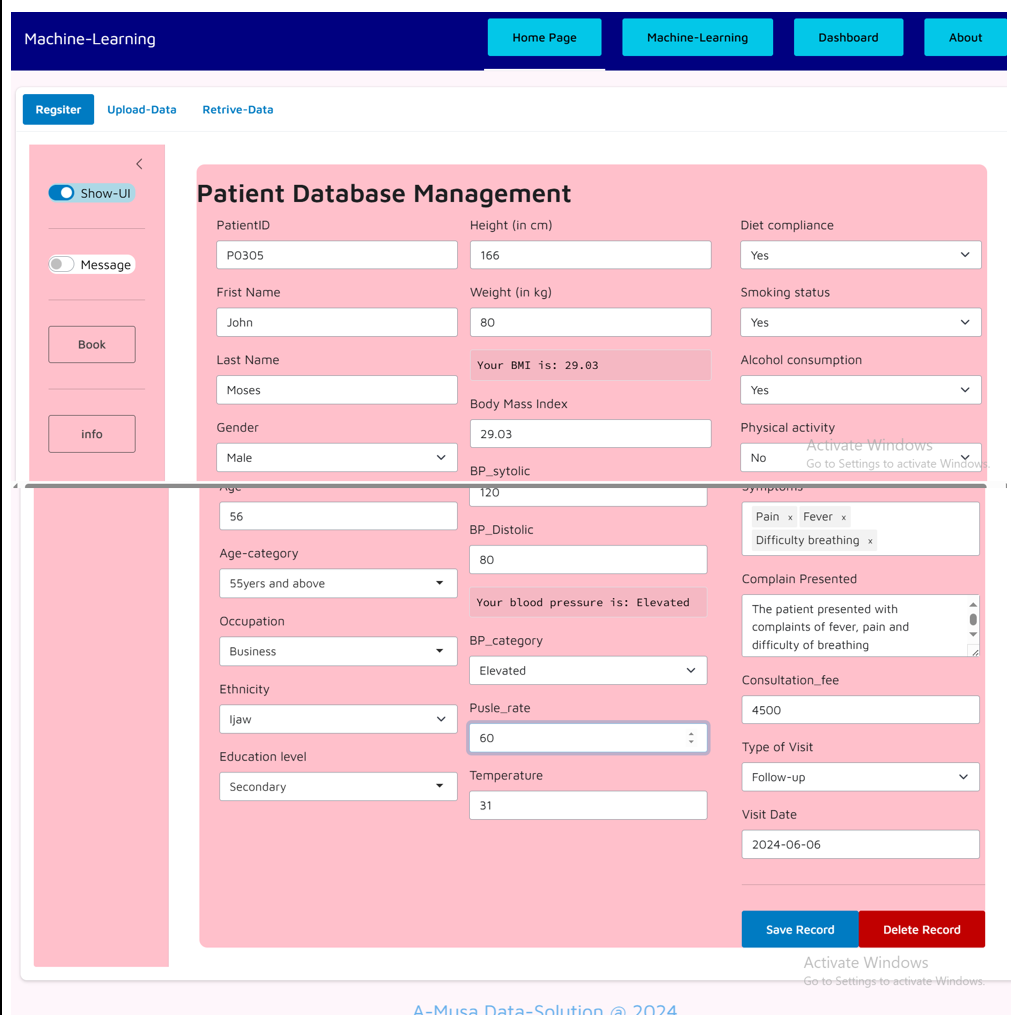
serve as an Electronic Health Record
- This section allows end users to register patients daily and store all the information on the database.
- Automatically calculated the body mass index and Blood pressure category
- It allows the end user to retrieve, delete and search patient record
- It allows the end user to book the patient for the next follow-up
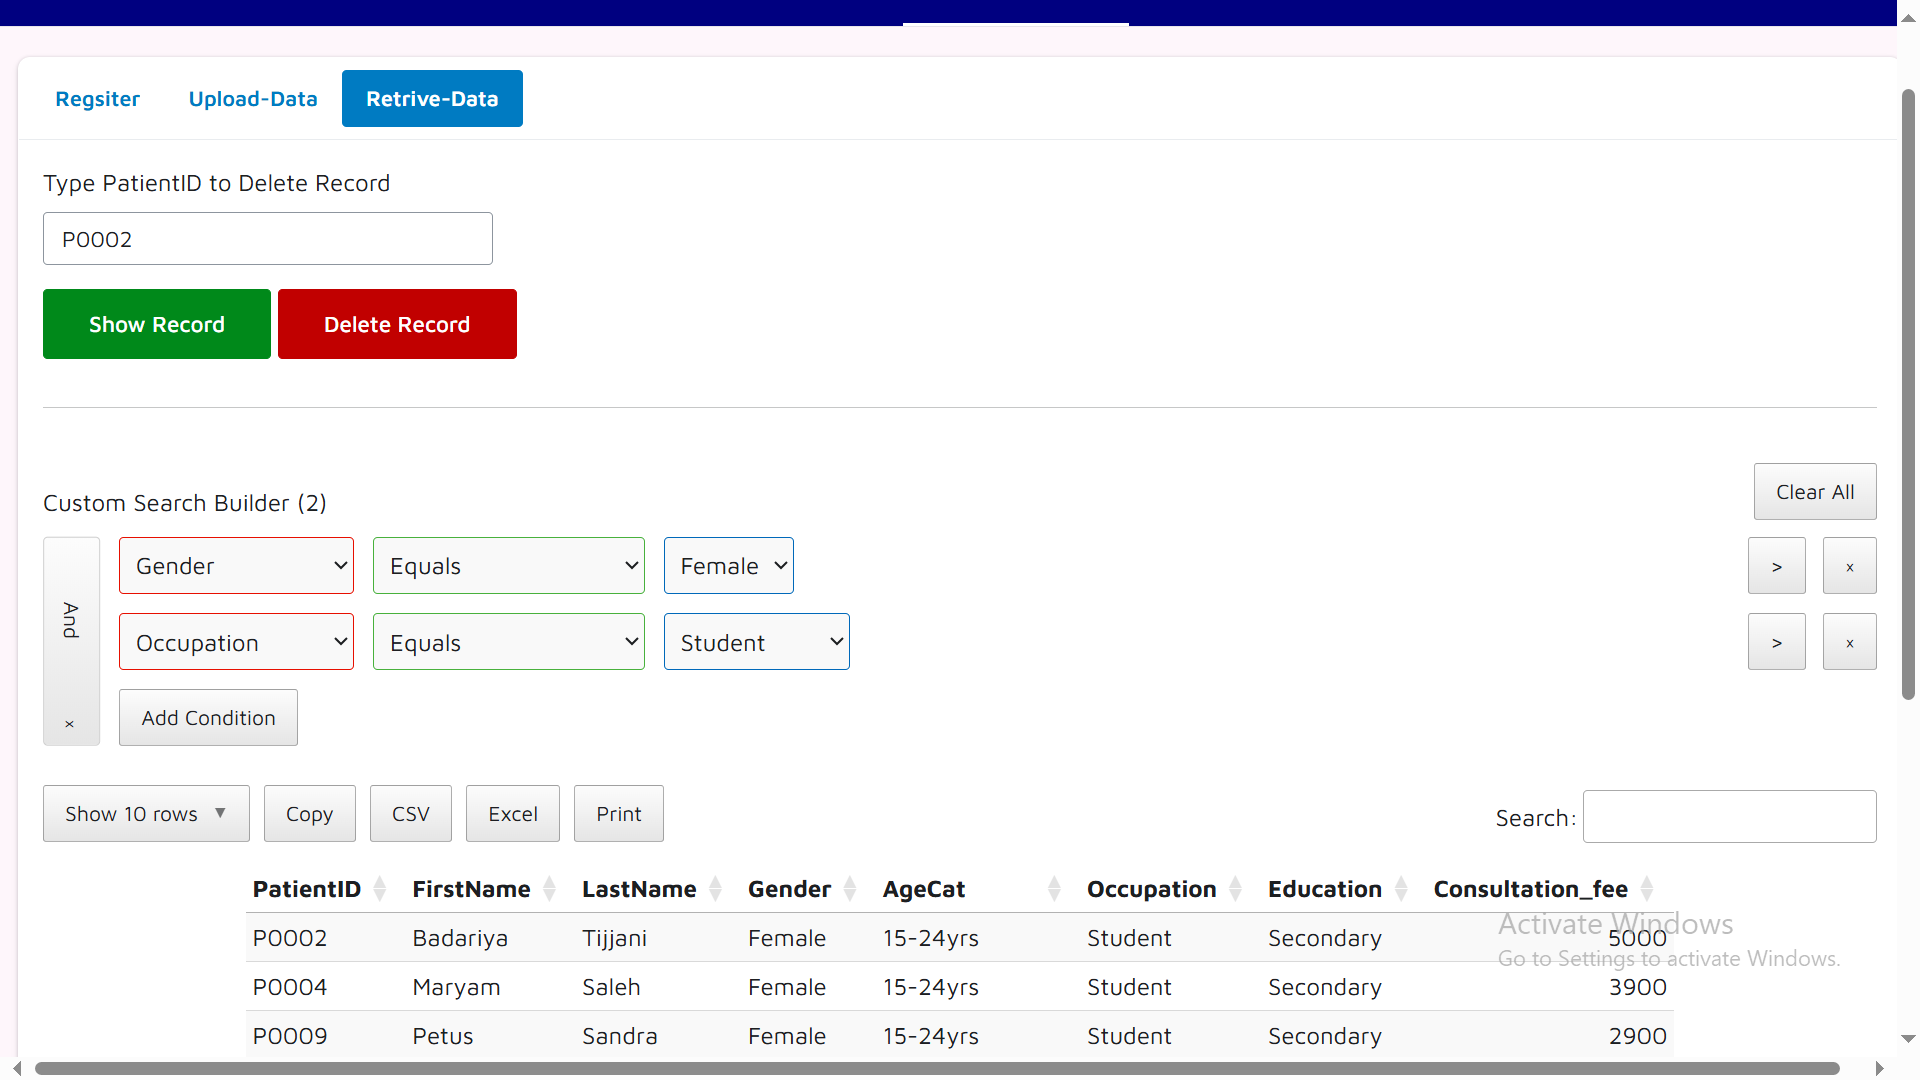
Data Retrieval Tab
The Data Retrieval Tab allows users to interact with the database to retrieve or delete data based on specific conditions. Users can apply conditional filtering to extract relevant patient data for analysis and decision-making.
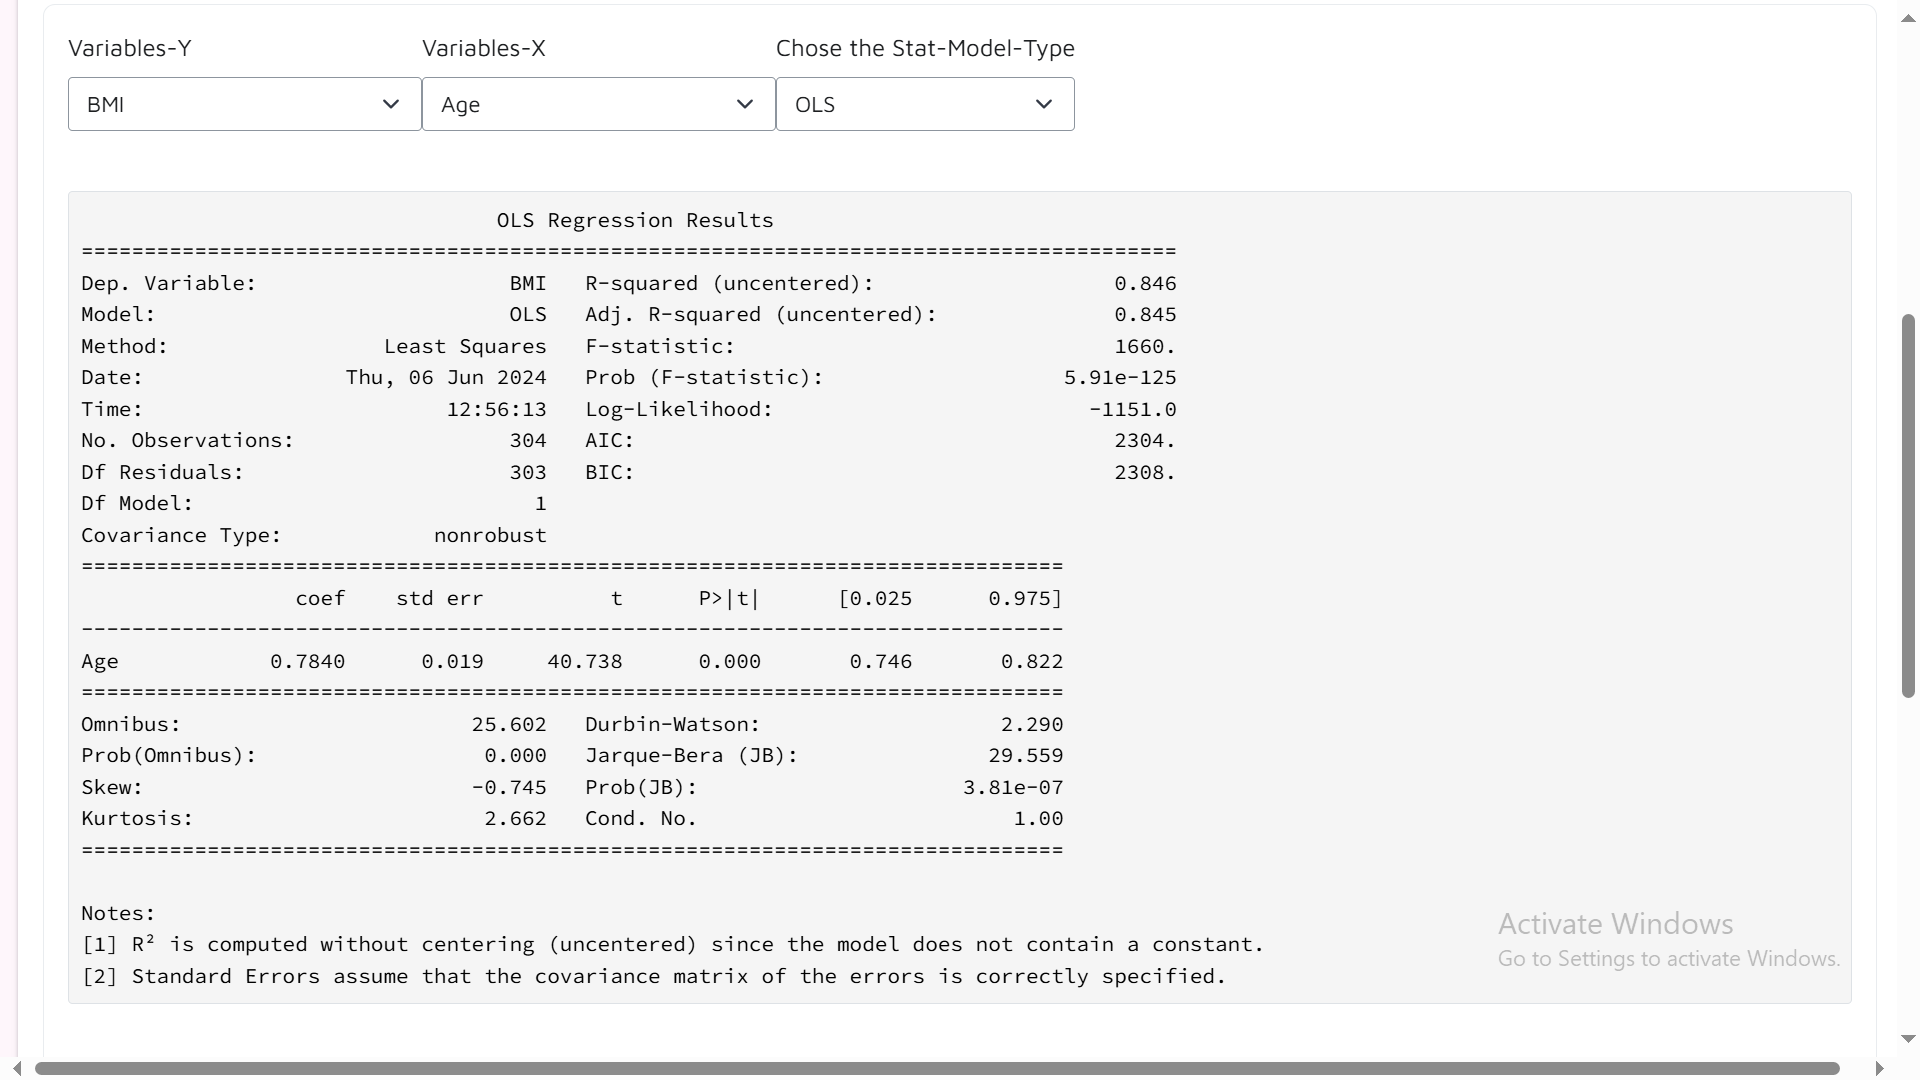
Data Exploratory Tab
The Data Exploratory Tab of the app allows users to explore statistical models for analyzing the dataset. Each model provides unique insights into the data distribution, relationships, and predictive power. data exploratory analysis using the following statistical models:
- Ordinary Least Squares (OLS)
- Weighted Least Squares (WLS)
- Generalized Least Squares (GLS)
- GLS AutoRegressive (GLSAR)
- Recursive Least Squares (RecursiveLS)
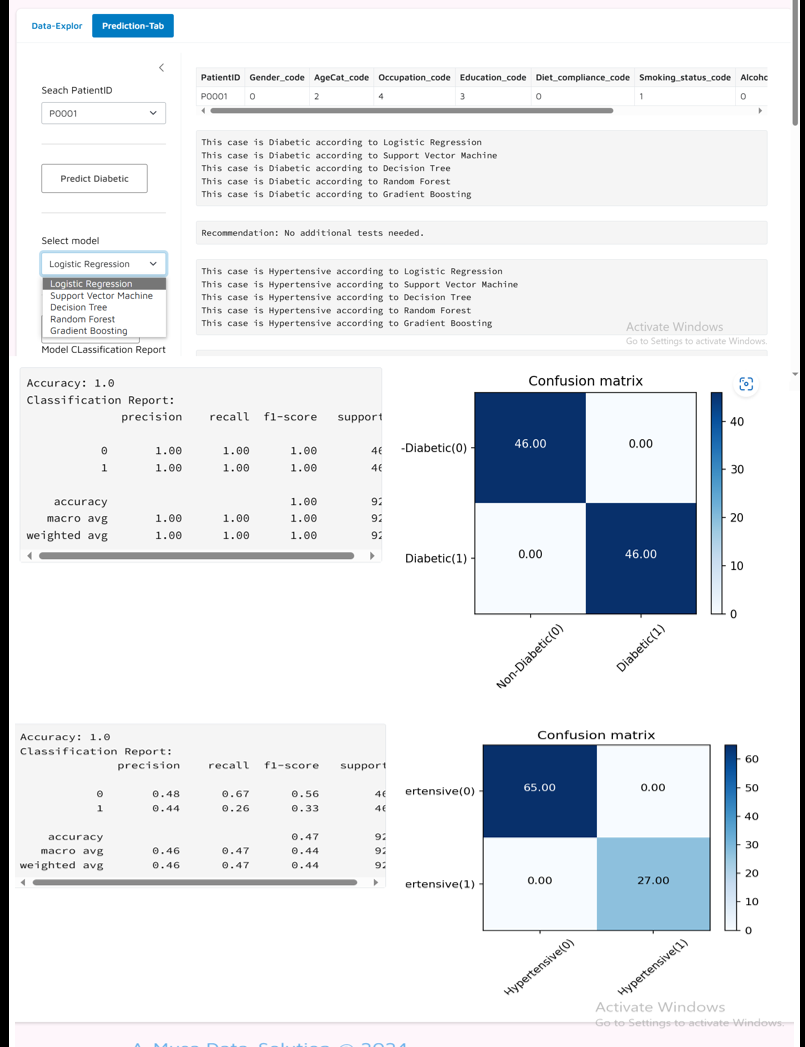
Machine-Learning
The doctor/Physician will not input data but instead search for a patient using their unique patient ID in the search box. After entering the patient ID, the doctor can click on the predict button to receive the prediction result for that specific patient. This streamlined process allows doctors to quickly access and analyze individual patient predictions without the need for manual data entry.
The app includes the following supervised machine-learning models for prediction:
- Logistic Regression
- Support Vector Machine
- Decision Tree
- Random Forest
- Gradient Boosting
Data Training-Test Split:
- Test Size: 30%
- Random State: 21
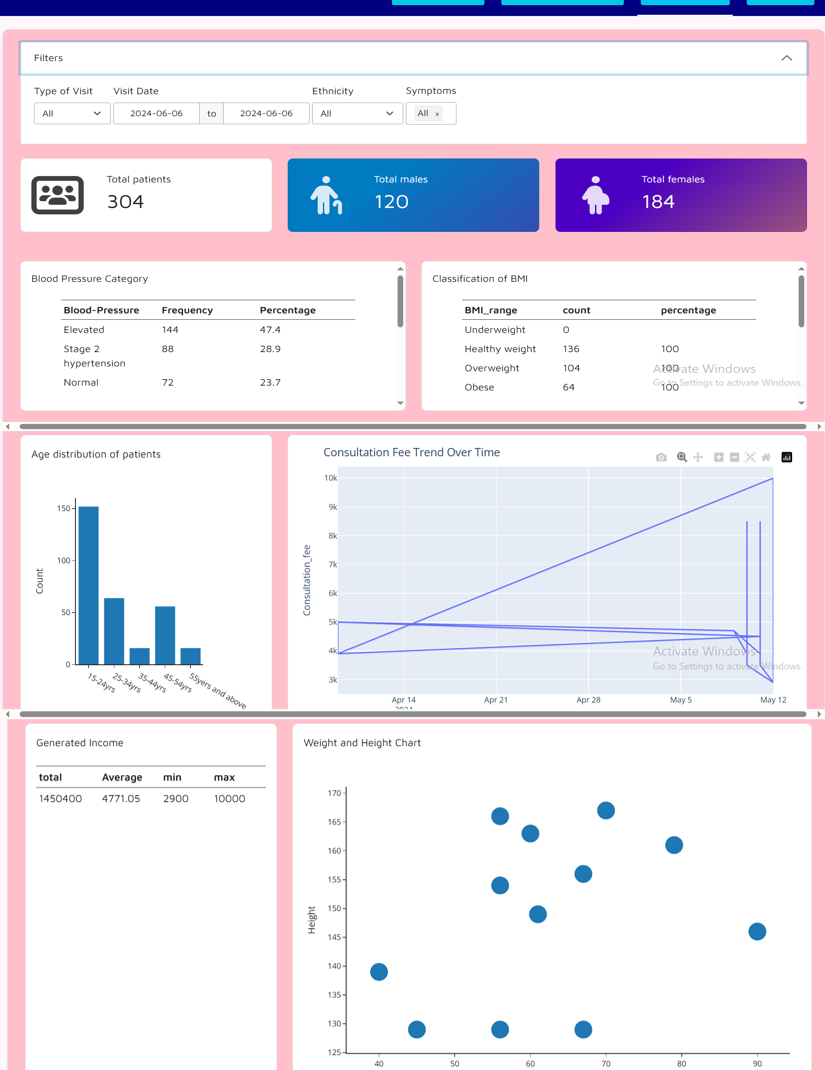
Dashboard Section: A comprehensive dashboard that offers various interactive components for managing and analyzing patient data effectively. The dashboard includes allow following key elements:
ValueBox: Displays essential metrics such as total registered, Male and Females patients,
Charts: Visual representations of data trends through various charts bar charts scatter plots to present age distribution and Weight and Height of patients.
Calculations of frequencies and percentages for patients whom are at risk of developing hypertension or diabetes
Line Chart: Dynamic chart showcasing the trend of consultation fees over a specified period.
Filtering Options: Interactive filters enable users to customize dashboard views based on specific criteria such as date ranges, patient characteristics, and diagnosis outcomes.
Video demo:
’
