NCD Atlas: Non-Communicable Disease Intelligence for Decision Makers, Built with shinyreact for Python
Non-communicable diseases (NCDs), such as hypertension, diabetes, chronic kidney disease, sickle cell disease and asthma, are now the leading cause of death worldwide. Health leaders need more than a spreadsheet of cases: they need to see where the burden is, who carries it, where care breaks down, and what to look at first. This post introduces NCD Atlas, an NCD intelligence dashboard, and explains how it is built with shinyreact for Python as a Core Shiny app: the server logic in Python, the UI in React.
Every record in this dashboard is synthetic. Nigerian state and LGA names are labels only. See the disclaimer at the end.
Why NCD intelligence matters for decision makers
According to the World Health Organization, NCDs kill about 41 million people each year, 74% of all deaths globally, and most premature NCD deaths occur in low- and middle-income countries. Many of these conditions are silent for years. Hypertension and type 2 diabetes are found by screening, and they cause harm when people are screened but never reach treatment, or are treated but never controlled.
A health commissioner, programme manager or state NCD desk officer usually has the records. What is often missing is a view that turns them into decisions:
- Prioritisation. Which conditions, and which states and LGAs, carry the largest burden, once you account for the age of the people screened?
- The care gap. Of the people found with a condition, how many are linked to treatment, and how many of those are controlled?
- Integration. Which conditions occur together, so that one visit could screen for both?
- Trust. How complete are the records, what was corrected, and is a change real or just noise?
NCD Atlas is built around those questions. Each page answers one of them, and every figure shows how much evidence stands behind it.
| Decision question | Page | What it shows |
|---|---|---|
| Which conditions carry the biggest burden, and is it changing? | 01 Executive overview | Total patients seen and five headline conditions, each with its share, change since 2020 and treatment linkage; trend panels; a seven-condition scorecard |
| Who is affected? | 02 Distribution · 03 Demographics | Recorded share with 95% intervals; age and sex profiles; who was screened, by setting and place of screening; treatment linkage by place of screening |
| Where are the gaps? | 04 State map | All 36 states and the FCT ranked and mapped; click a state to drill to its LGAs on real boundaries |
| Is it getting better or worse? | 05 Trends | Yearly and quarterly rates; a change is called clear only when the 95% intervals do not overlap |
| What goes with each condition? | 06 Risk factors | Adjusted odds ratios from a logistic regression; stacking lifestyle factors; BMI and age gradients |
| Which conditions come together? | 07 Comorbidity | A lift matrix, the strongest pairs and the most common combinations |
| What should we look at first? | 08 Recommendations | Suggested questions, each with what the data shows, what to consider and what to check first; states with the largest treatment gap |
A walk through NCD Atlas
The app works on 59,888 synthetic screening records from 2020 to 2025, across Nigeria's 36 states, the FCT and their 774 LGAs. The names are real, so the demonstration feels familiar; every number is invented and randomly assigned, so nothing here describes a real state.
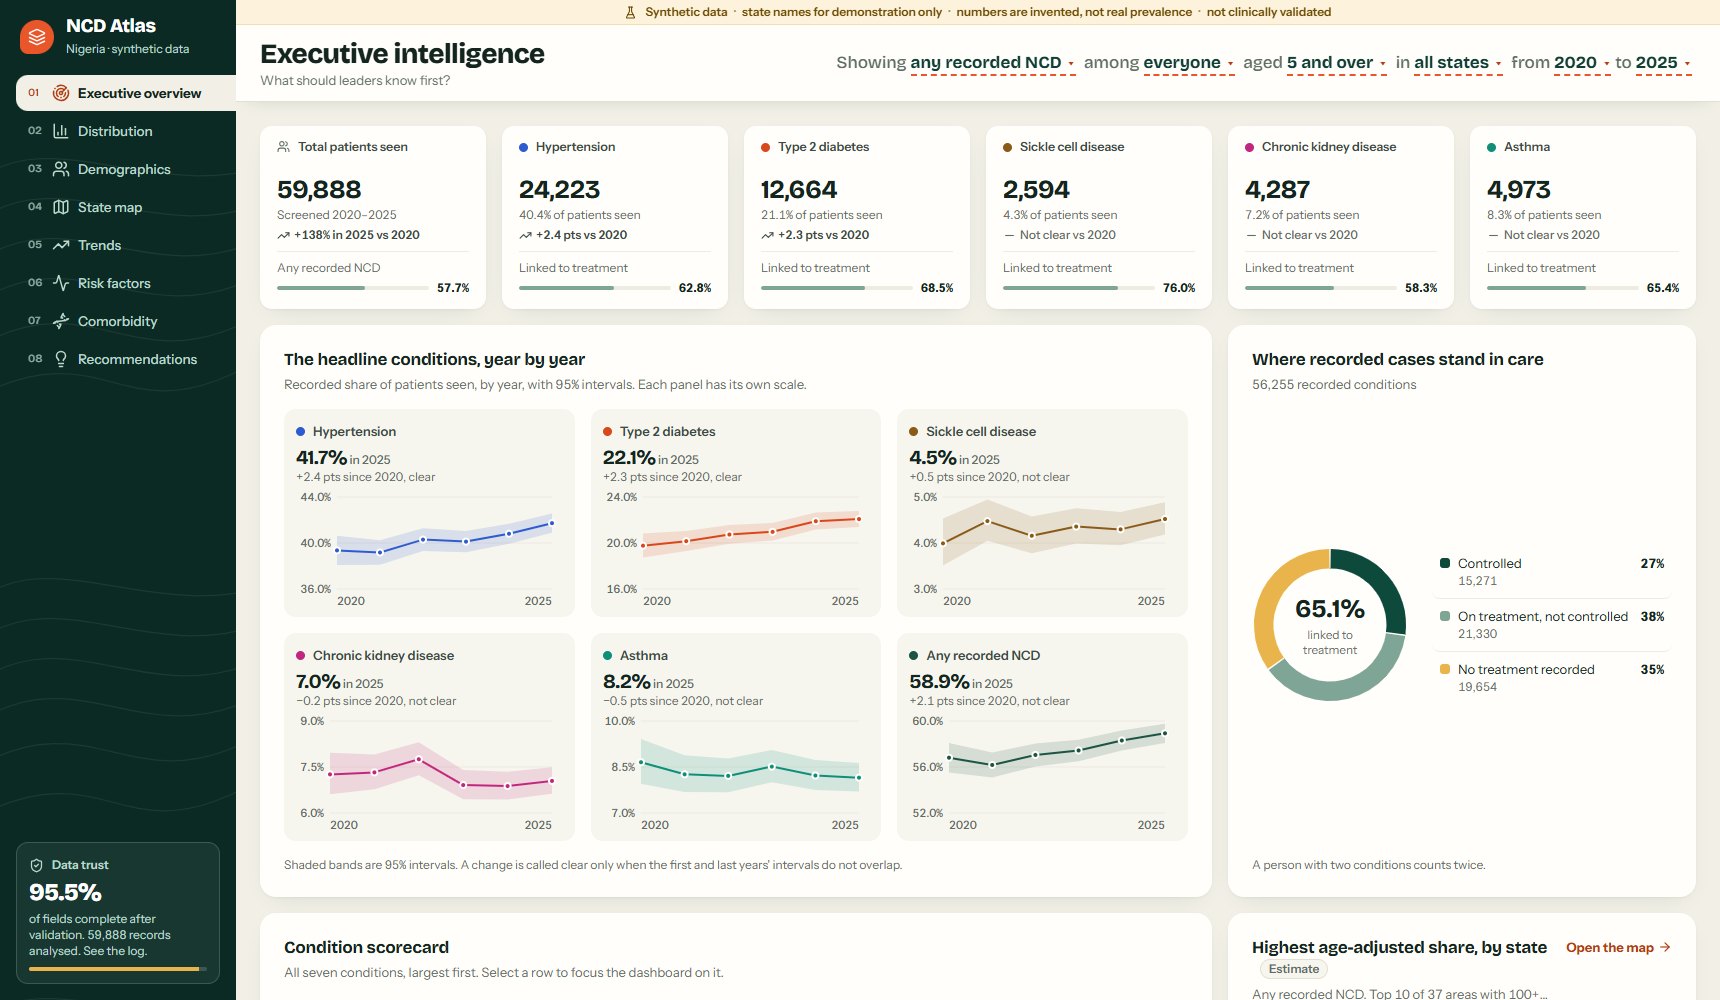
The value boxes start with the total patients seen (59,888), followed by hypertension, type 2 diabetes, sickle cell disease, chronic kidney disease and asthma. Each box gives the number of cases, the share of patients seen (hypertension: 40.4%), the change since 2020, and a small meter for treatment linkage. A change is labelled only when the 95% intervals for 2020 and 2025 do not overlap; otherwise the box says "No clear change". Clicking a box focuses the whole dashboard on that condition.

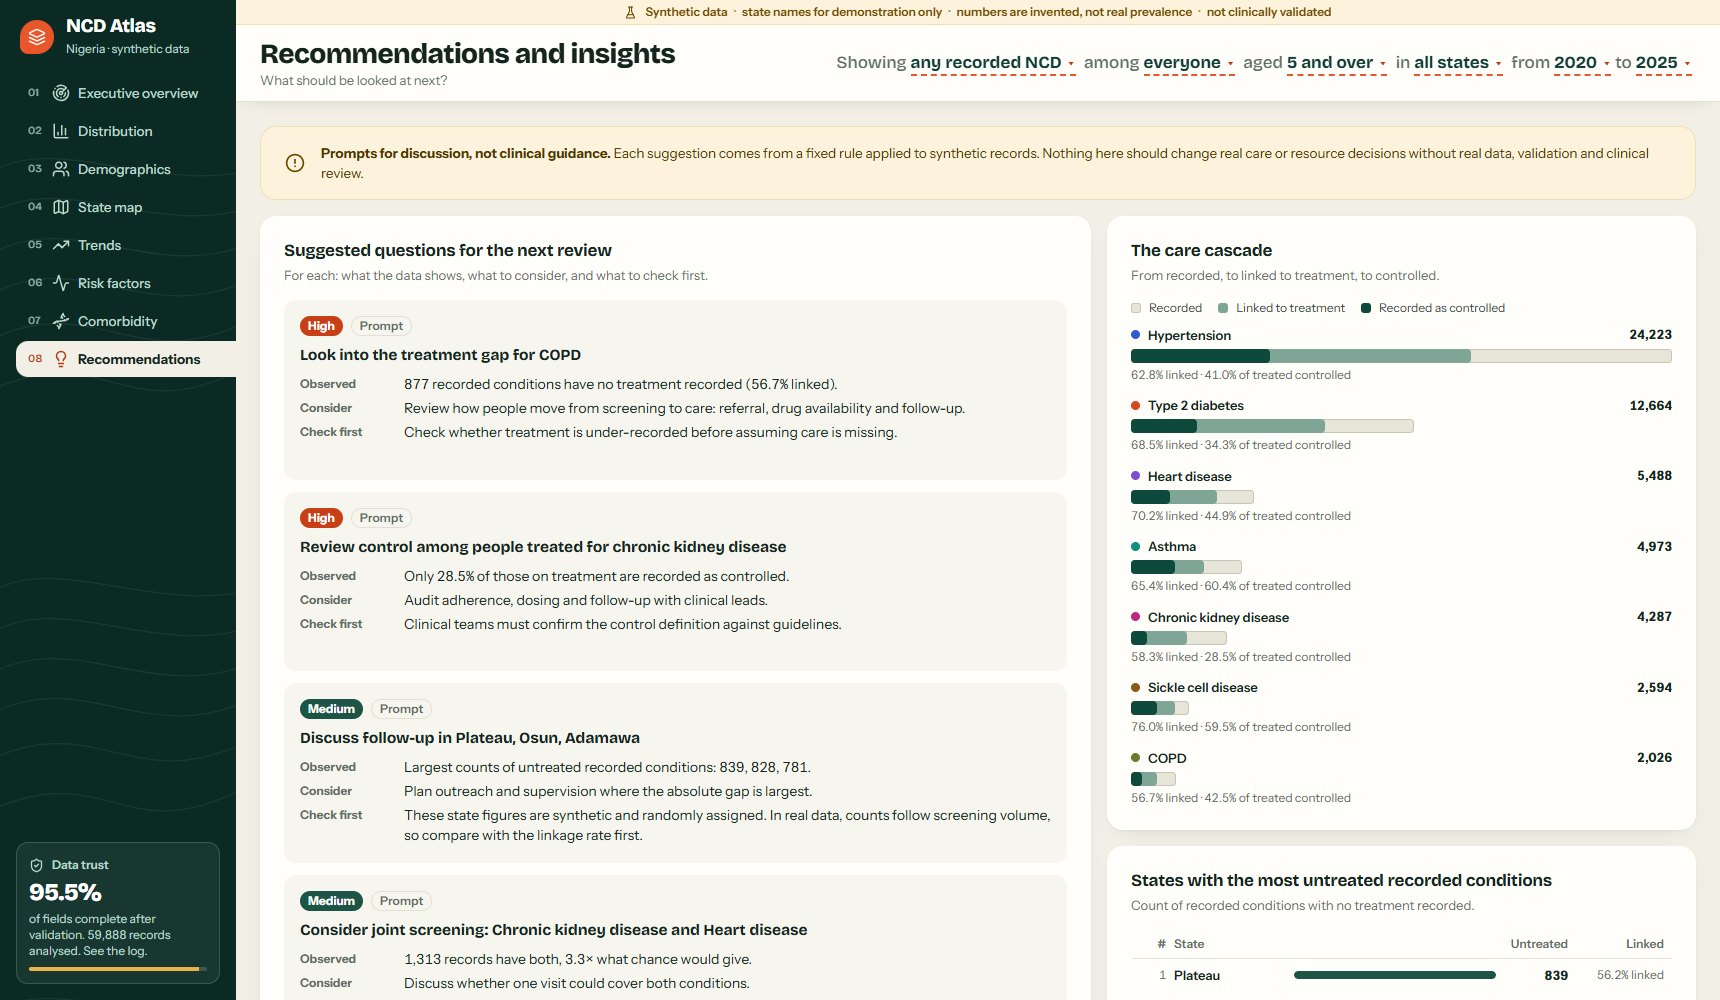
The care donut answers the question a programme manager asks first: of 56,255 recorded conditions, 65.1% are linked to treatment, and the rest have no treatment recorded. The scorecard repeats this for all seven conditions, side by side.
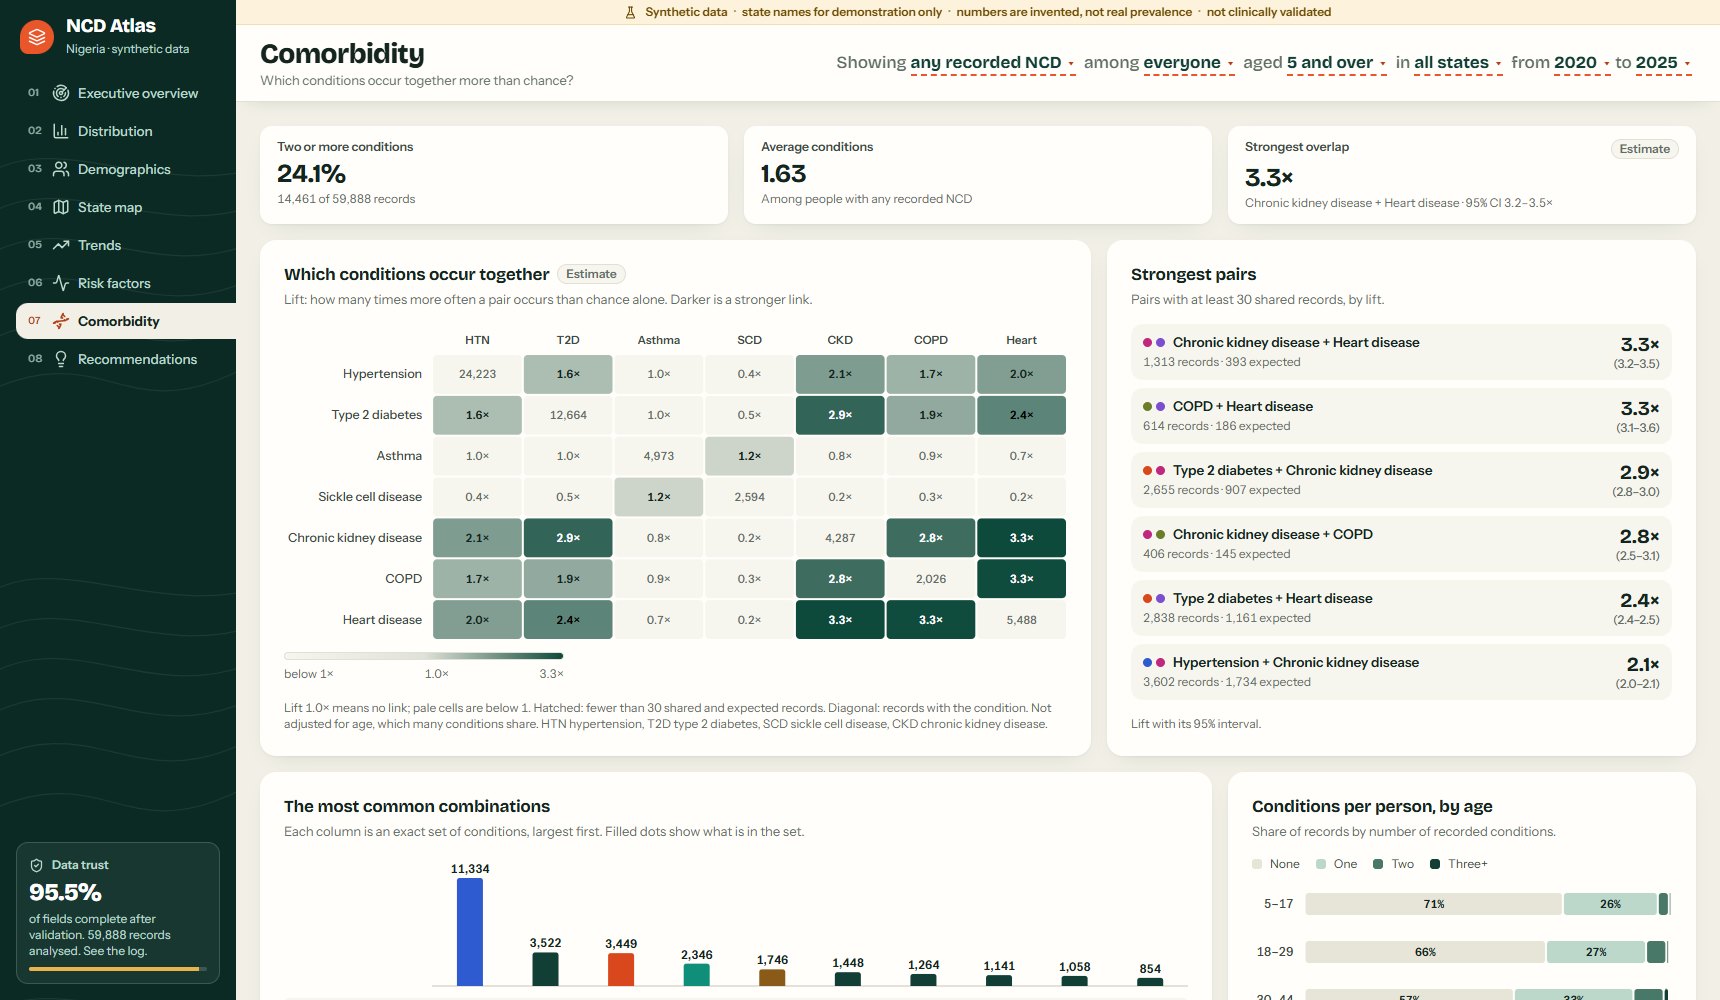
The state map ranks all 37 areas next to the map. Click a state, and the map drills down to its LGAs on real boundaries (GRID3 via geoBoundaries).
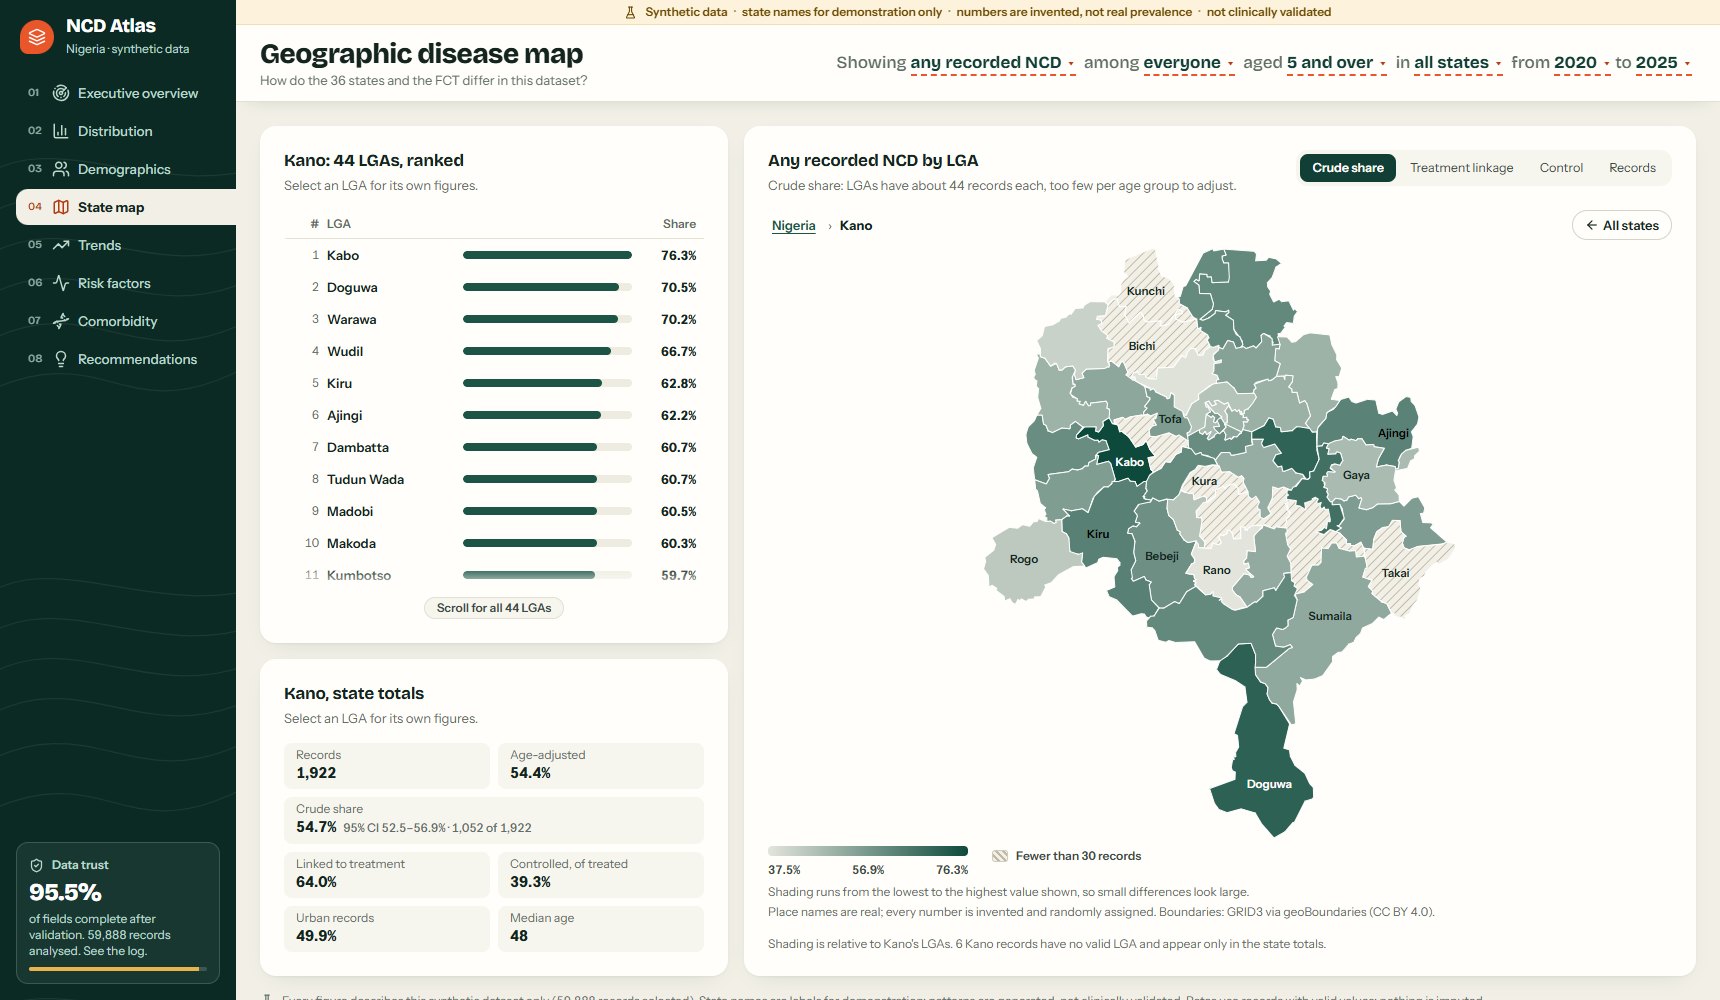
Risk factors are shown as adjusted odds ratios from a logistic regression, with 95% intervals. In this synthetic data, the share with hypertension rises from 31% among people with no lifestyle risk factors to 61% among those with three or more. The page says plainly that these are observed associations, not a clinical risk score.
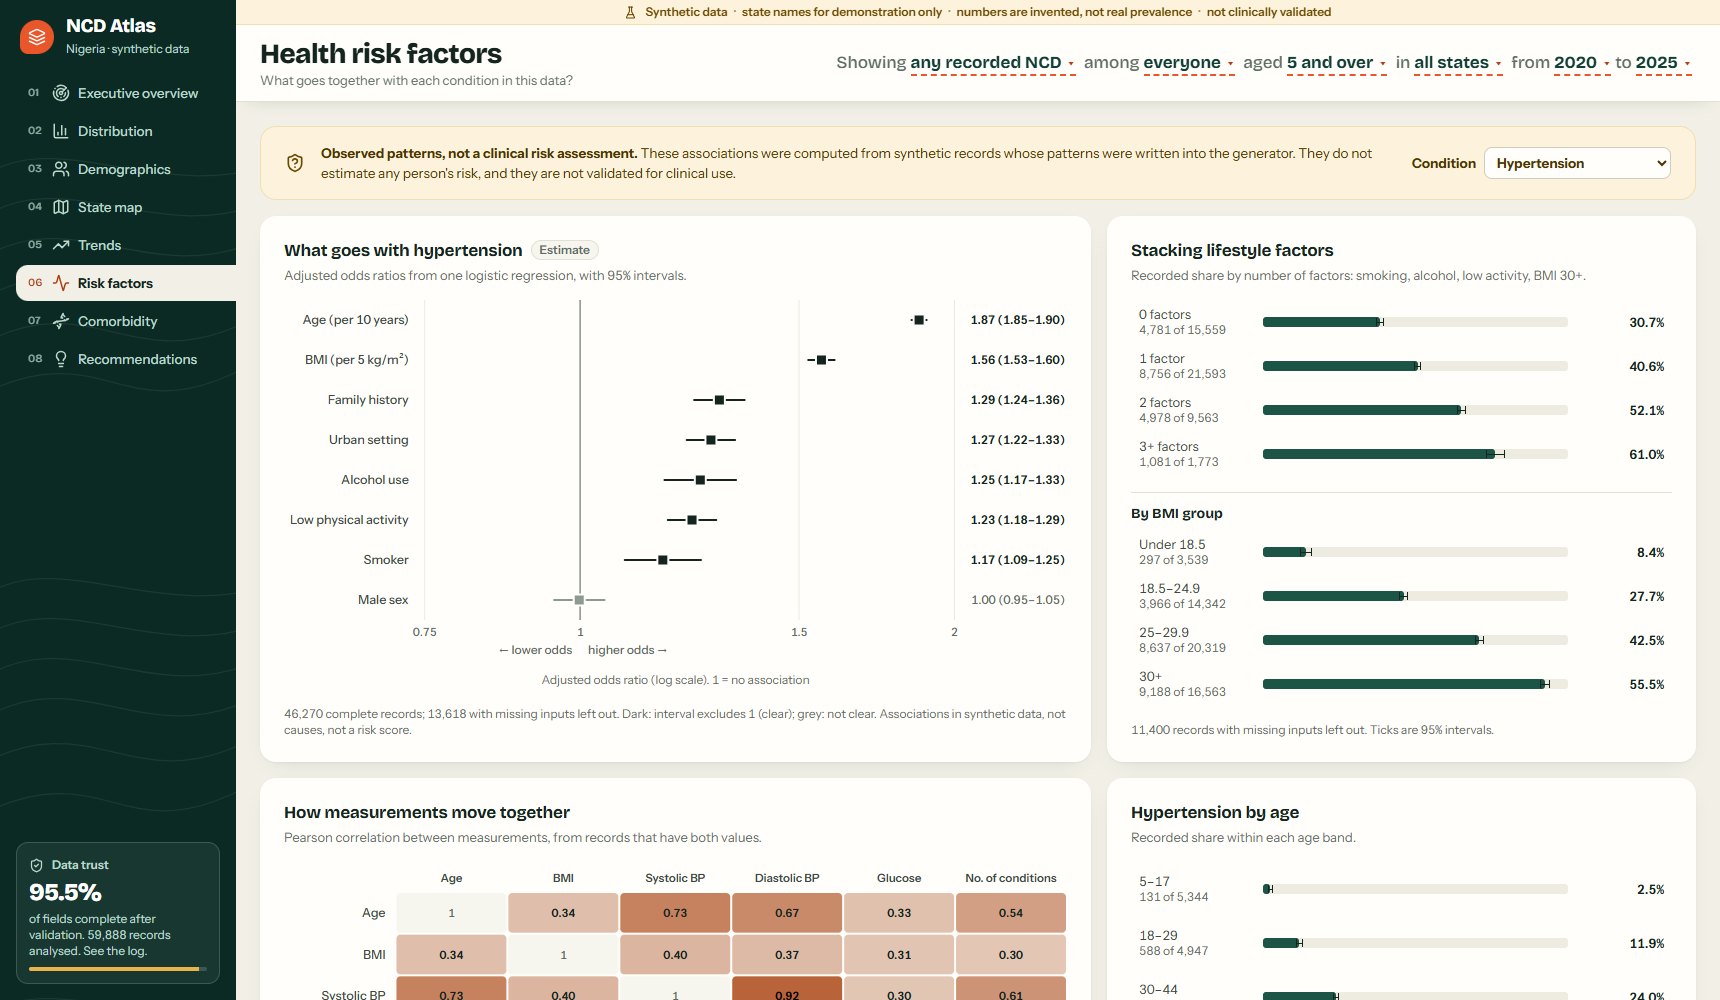
Comorbidity uses lift: how many times more often two conditions occur together than chance alone would give. The strongest pair is chronic kidney disease with heart disease: 1,313 records have both, 3.3× what chance would give. 24% of people screened have two or more conditions.
Recommendations turn patterns into questions, never instructions. Each card has three lines: what the data shows, what to consider, and what to check first. For example: "Look into the treatment gap for COPD. 877 recorded conditions have no treatment recorded (56.7% linked)." The check: "Check whether treatment is under-recorded before assuming care is missing."
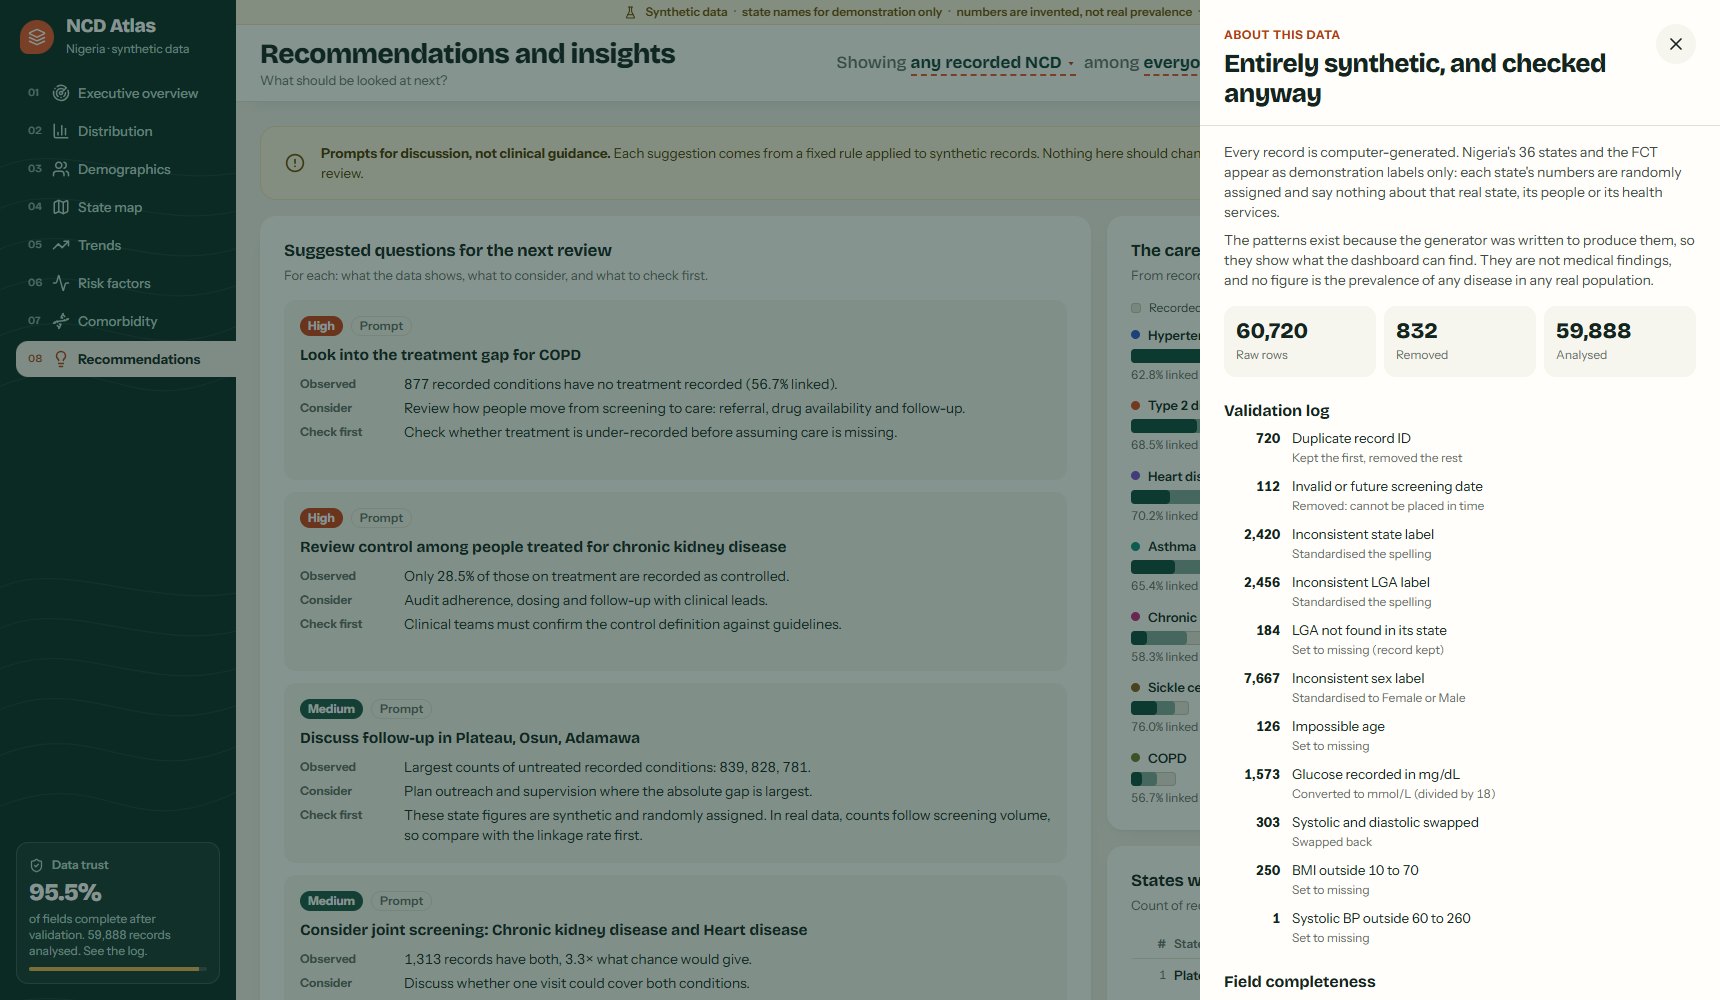
Data trust is one click away on every page. The validation log lists every correction: 60,720 raw rows came in, 832 were removed (duplicates and impossible dates), and 14,980 values were corrected, such as glucose recorded in mg/dL and swapped blood pressure readings. Nothing is imputed. Fields are 95.5% complete overall, and the log flags that BMI is missing for 24.6% of community outreach records against 5.5% elsewhere, a pattern that can bias risk-factor results.
Watch the tutorial
How shinyreact works
shinyreact is a new package from Posit that lets a React application use Shiny as its server. If you know Shiny for Python, the server side looks familiar. The difference is the interface: instead of Shiny's UI functions, you write React components, and shinyreact provides the hooks that connect them to Shiny inputs and outputs.
NCD Atlas is a Core Shiny app, so it has the two parts every Core app has. The UI is page_react(), which serves the React bundle in place of Shiny's UI functions. The server is an ordinary server(input, output, session) function, in which @reactive_output turns a Python function into a Shiny output that returns data instead of HTML. App(app_ui, server) joins the two. NCD Atlas has only two outputs: meta (conditions, states, boundaries, the validation report) and view (everything the current page needs).
# app.py (abridged): a Core Shiny app with a React interface
from shiny import App, Inputs, Outputs, Session
from shinyreact import page_react, reactive_output

ENGINE = Engine(load())               # data validated once per process, shared by all sessions

# ---- UI: the React bundle (src/ built to www/ui.js)
app_ui = page_react(title="NCD Atlas · synthetic data")

# ---- server: inputs in, JSON out
def server(input: Inputs, output: Outputs, session: Session):
    @reactive_output
    def view():
        page = input.page()
        filters = Filters.parse(input.filters())
        return ENGINE.view(page, filters)   # a plain dict, sent as JSON

app = App(app_ui, server)
In the browser, useShinyOutputValue("view") returns the latest value of that output, and useSetShinyInput("filters", …) returns a function that sets a Shiny input. Whenever an input changes, Shiny re-runs view() and React redraws with the new JSON.
// App.tsx: the same output and inputs, from React
const view = useShinyOutputValue<any>("view");
const sendPage = useSetShinyInput<string>("page", page, { debounceMs: 0 });
const sendFilters = useSetShinyInput<Filters>("filters", START, { debounceMs: 0 });

const set = (patch: Partial<Filters>) => {
  const next = { ...f, ...patch };
  setF(next);
  sendFilters(next);                   // Python re-runs view(); React redraws
};
This split has three advantages for a health dashboard:
- One source of truth. Every rate, interval and odds ratio is calculated once, in tested Python (97 unit tests). The browser never recalculates, so the figures in the app, the tests and this article are the same.
- Full design control. The value boxes, choropleth maps, forest plots and lift matrix are hand-written SVG components, with the layout, accessibility and responsive behaviour I wanted, on phone and desktop.
- Familiar Shiny deployment. It is still a Shiny app, exported as
app = App(app_ui, server):shiny run app.pylocally, and the same command on a server such as Render. The React code is built once with Vite into a single file.
Why Core Shiny, not Shiny Express
Shiny for Python offers two ways to write an app. Shiny Express lets you write UI and server code together in one script, which is quick for a small prototype. Core Shiny asks you to define the UI and the server separately and join them with App(app_ui, server). shinyreact supports both: set_react_page() in Express, and page_react() or ReactApp in Core. For a dashboard that decision makers will rely on, I recommend Core Shiny, and NCD Atlas uses it.
| Shiny Express | Core Shiny | |
|---|---|---|
| Structure | UI and server code mixed in one script | UI (app_ui) and server logic (server()) defined apart, joined by App() |
| Shared data | The script re-runs for every session, so loading data once needs a workaround | Module code runs once per process; every session shares the validated data |
| Testing | Outputs are created as the script runs | server and the analytics are plain functions you can import and test |
| Teamwork | One script for everyone | The frontend owns the UI (React), the backend owns the server: a clear contract between them |
| Best for | Quick prototypes and small apps | Production dashboards that will grow |
The separation matters even more with shinyreact, because the UI is a separate React project. In Core Shiny the code says so: app_ui is the React page, server is the Python logic, and the only things that pass between them are named inputs and outputs. NCD Atlas was first written in Express. Moving it to Core removed a caching workaround and made the server easier to read and test. For comparison, the Express version:
# The first version, in Shiny Express: UI and server share one script
from shiny.express import input
from shinyreact import reactive_output, set_react_page

set_react_page()                      # the UI is set as a side effect

def _shared():                        # Express re-runs this file for every session,
    ...                               # so shared data needed a cache workaround

@reactive_output
def view(): ...
Honest numbers
Honesty about uncertainty is built into the analytics. Every rate carries a 95% Wilson interval, rates with fewer than 30 records are not shown at all, and state comparisons are age-standardised so that a state with older patients does not look worse for that reason alone.
def wilson(k, n):
    """95% Wilson interval for a proportion."""
    z, p = 1.96, k / n
    den = 1 + z * z / n
    mid = p + z * z / (2 * n)
    half = z * np.sqrt(p * (1 - p) / n + z * z / (4 * n * n))
    return (max(0, (mid - half) / den), min(1, (mid + half) / den))
What I learned
- Keep the UI and the server apart. Core Shiny makes the boundary explicit: React draws, Python decides. That made the app easier to test and easier for a team to work on.
- Start from decisions, not charts. Each page answers one question a decision maker would ask. Charts that did not help answer it were removed.
- Uniform design helps comparison. Every value box has the same layout and colour. A condition's colour appears only as a small dot, so it identifies the condition and nothing more.
- Small numbers mislead. At LGA level, many areas have too few records for a stable rate. The map hatches them rather than colouring them, and says why.
- Say what the data cannot do. Odds ratios are associations; recommendations are prompts; and real deployments need real, governed data and clinical review.
Conclusion
NCDs are a growing challenge for health systems, and the records to monitor them often exist already. An NCD intelligence dashboard turns those records into the questions decision makers need to answer: where the burden is, who carries it, where care breaks down, and what to check first. shinyreact for Python makes it possible to build that dashboard with Python's analytical strength and React's flexibility, and Core Shiny keeps the two cleanly apart: the UI in React, the server logic in Python, joined in one app.
I'd like to hear from NCD programme managers, M&E officers and health data teams: what would you add, and how would you want these figures presented? You may also like DHIS2 interoperability with Power BI and Shiny and Pulse, earlier dashboards in the Health Data Lab series.
Every record in this dashboard is synthetic. Nigerian state and LGA names are labels only. See the disclaimer at the end.
- Every record is synthetic, generated by a computer program. No real patient data was used.
- Nigerian state and LGA names are demonstration labels. Their numbers are invented and randomly assigned, and say nothing about the real prevalence of any disease in any state, LGA or population.
- The patterns exist because the generator was written to produce them. They are not clinically validated, and the odds ratios are not a clinical risk score.
- Any real-world use would require real, governed data, data protection, validation and interpretation by qualified public health and clinical professionals.