# import folium
# import geopandas
# import pandas as pd
#
# survey_data = pd.read_csv("gis.csv")
# df = survey_data.loc[:, ('State', 'LGA', 'Type of Community ','1. Gender', '2. Level of Education*','Age range', 'Marital Status', 'latitude', 'longitude',)]
#
# # Create point geometries
# geometry = geopandas.points_from_xy(survey_data.longitude, survey_data.latitude)
# geo_df = geopandas.GeoDataFrame(
#     df, geometry=geometry
# )
# def style_function(feature):
#     props = feature.get('properties')
#     markup = f"""
#         <a href="{props.get('url')}">
#             <div style="font-size: 0.8em;">
#             <div style="width: 10px;
#                         height: 10px;
#                         border: 1px solid black;
#                         border-radius: 5px;
#                         background-color: blue;">
#             </div>
#             {props.get('name')}
#         </div>
#         </a>
#     """
#     return {"html": markup}
#
# def map_output():
#
#     # Create a Folium map centered around Nigeria
#     m = folium.Map(location=[9.0820, 8.6753], zoom_start=6, tiles="Esri WorldImagery")  # Centered around Nigeria
#     # m = folium.Map(location=[9.0820, 8.6753], zoom_start=6, tiles="OpenStreetMap")  # Centered around Nigeria
#     # Define marker colors (you can customize these)
#     marker_colors = ["red", "orange", "green", "blue", "purple", "pink",
#                     "brown", "gray", "black", "darkred", "lightblue", "beige"]
#
#
#
#     # Add GeoJSON layer for each state with markers for LGAs
#
#     for state in geo_df["State"].unique():
#         state_data = geo_df[geo_df["State"] == state]
#
#         # Create a FeatureGroup for the state
#         fg = folium.FeatureGroup(name=state)
#
#         # Add markers for each LGA within the state
#         for index, row in state_data.iterrows():
#             # Cycle through marker colors
#             color_index = index % len(marker_colors)
#
#              # Create the marker label combining that individual profile
#             label_text = f"{row['1. Gender']}: {row['2. Level of Education*']}"
#
#             folium.Marker(
#                 location=[row["latitude"], row["longitude"]],
#                 popup=folium.Popup(
#                     f"<strong>State:</strong> {row['State']}<br>"
#                     f"<strong>LGA:</strong> {row['LGA']}<br>"
#                     f"<strong>Gender:</strong> {row['1. Gender']}<br>"
#                     f"<strong>Level of Education:</strong> {row['2. Level of Education*']}<br>"
#                     f"<strong>Age Range:</strong> {row['Age range']}<br>"
#                     f"<strong>Marital Status:</strong> {row['Marital Status']}"
#
#
#                 ),
#                 icon=folium.Icon(color='blue', icon_color=marker_colors[color_index], icon="info-sign"), tooltip=label_text
#             ).add_to(fg)
#         # Add the FeatureGroup to the map
#             fg.add_to(m)
#     # Add map controls
#     # folium.plugins.Draw(export=True).add_to(m)
#     folium.LayerControl().add_to(m)
#     folium.LatLngPopup().add_to(m)
#     folium.plugins.Fullscreen(
#         position="topright",
#         title="Expand me",
#         title_cancel="Exit me",
#         force_separate_button=True,
#     ).add_to(m)
#
#     # Correct TagFilterButton usage (assuming 'State' is the property to filter by)
#     # TagFilterButton('state_name').add_to(m)
#
#     folium.plugins.Geocoder().add_to(m)
#     folium.plugins.LocateControl(auto_start=False).add_to(m)
#     return m
#
# map_output()Visualizing Geospatial Data: A Step-by-Step Guide with Folium, KoboToolbox, and Google Colab
Have you ever wondered how to turn raw location data into insightful maps? This blog post will guide you through the process of analyzing and visualizing geospatial data collected through KoboToolbox, using the power of Folium and Google Colab. Whether you’re a researcher, NGO worker, or simply curious about geospatial analysis, this guide will provide you with the tools and knowledge to create compelling visualizations
GIS-Health Monitoring System, a powerful tool that transforms raw data into actionable insights for healthier communities:
What is Geospatial Data?
Before we dive in, let’s clarify what we mean by “geospatial data.” Simply put, it’s any data that includes information about location. This could be anything from the GPS coordinates of a survey respondent’s house to the boundaries of a protected forest area
Tools of the Trade
We’ll be using three powerful tools for this project:
KoboToolbox: A free and open-source tool for creating forms and collecting data, including GPS coordinates.
Google Colab: A cloud-based platform that allows you to write and execute Python code in your browser, without any complicated software installations.
Folium: A Python library that makes it easy to create interactive maps.
Pykobo: A free and open-source Python library that allows us to connect to our KoboToolbox server
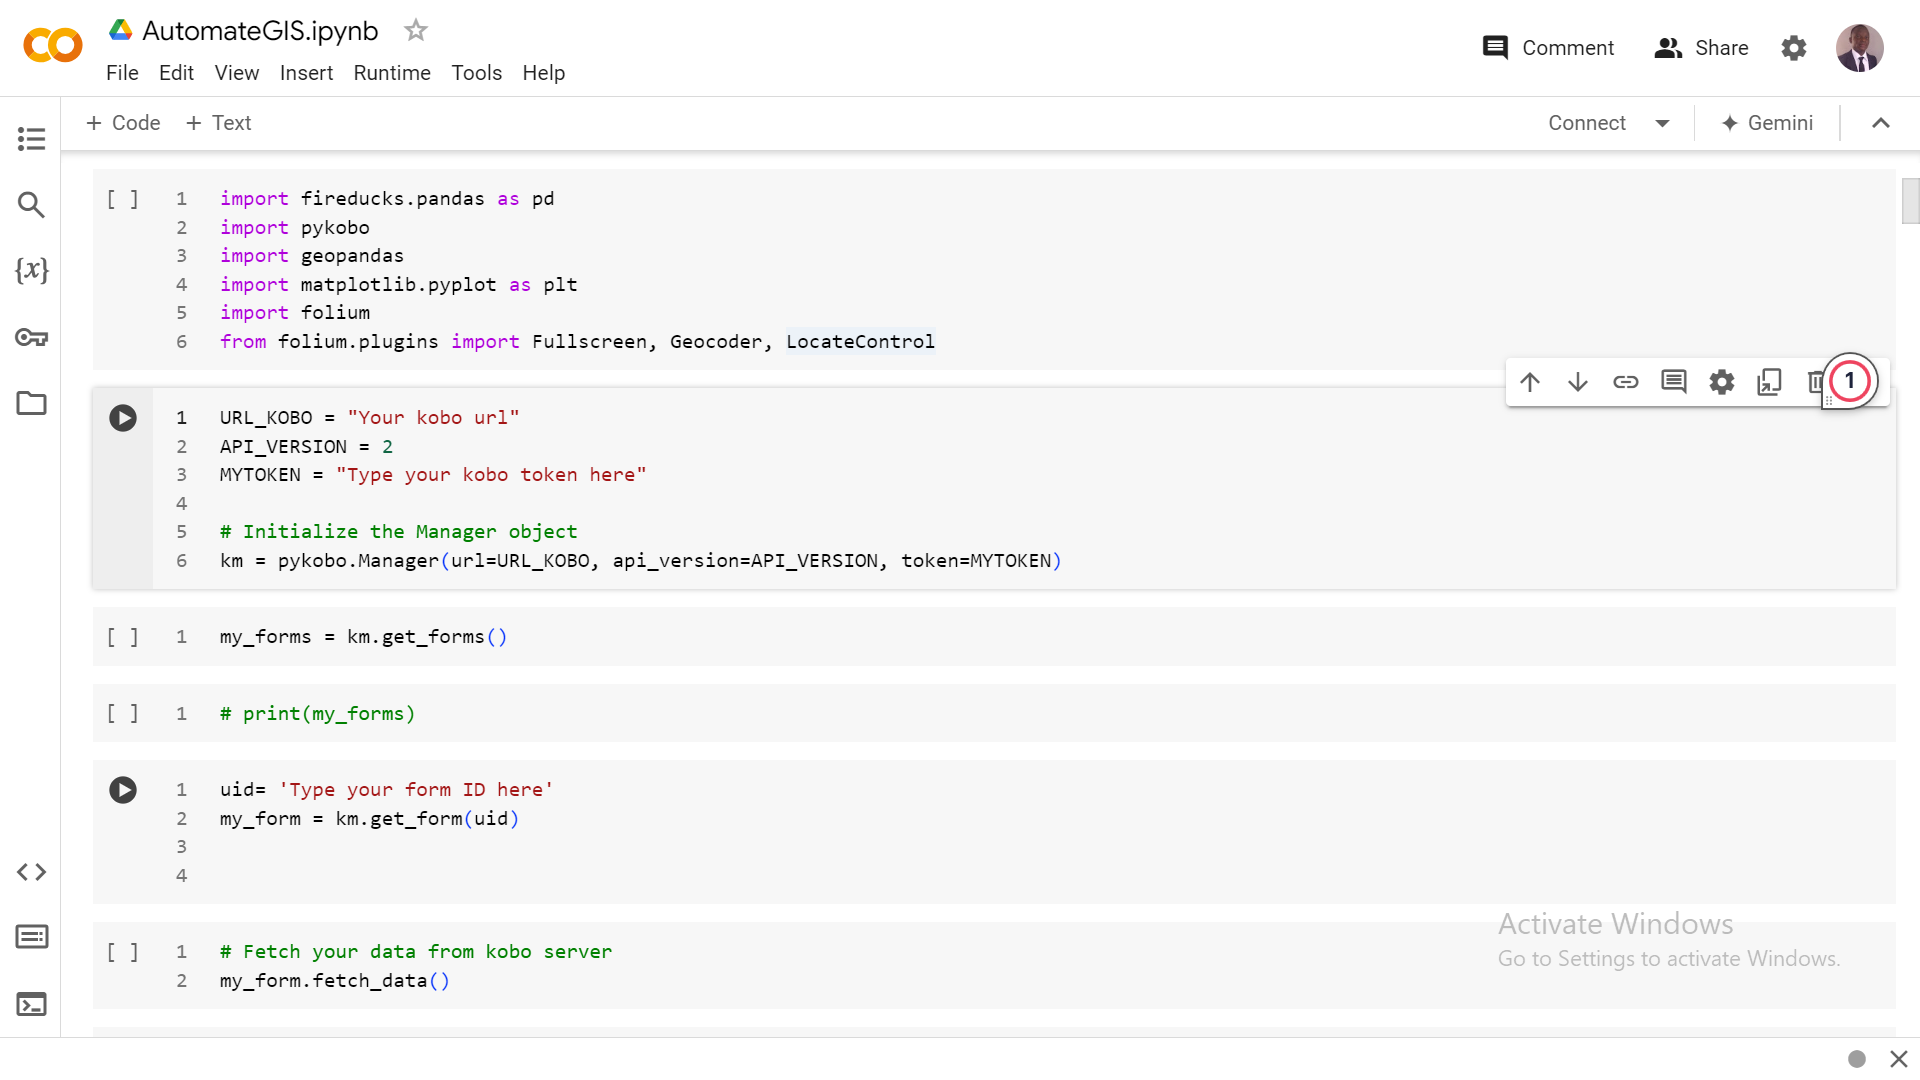
Import Libraries and Established a connection to your Kobotoolbox Account:
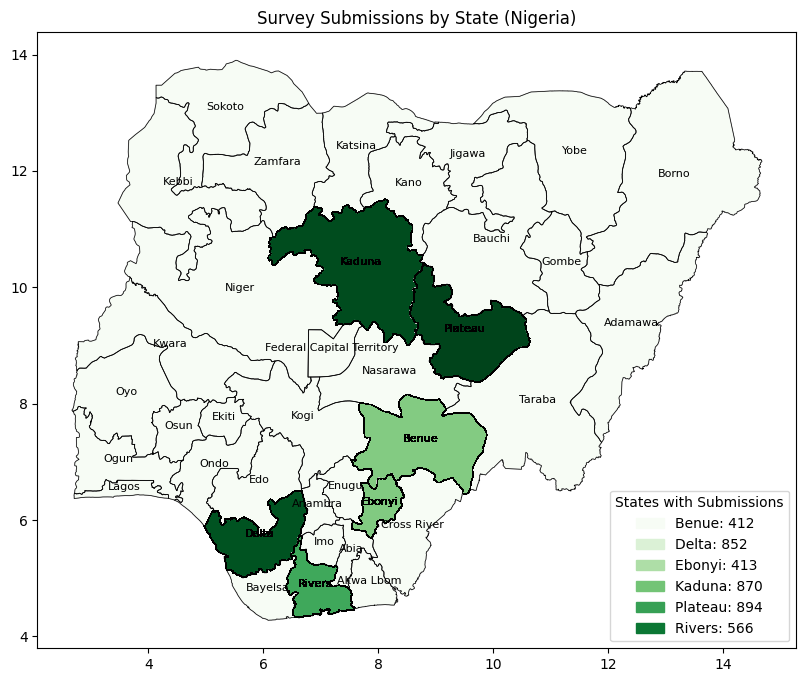
Generate Static Map for Report Writing
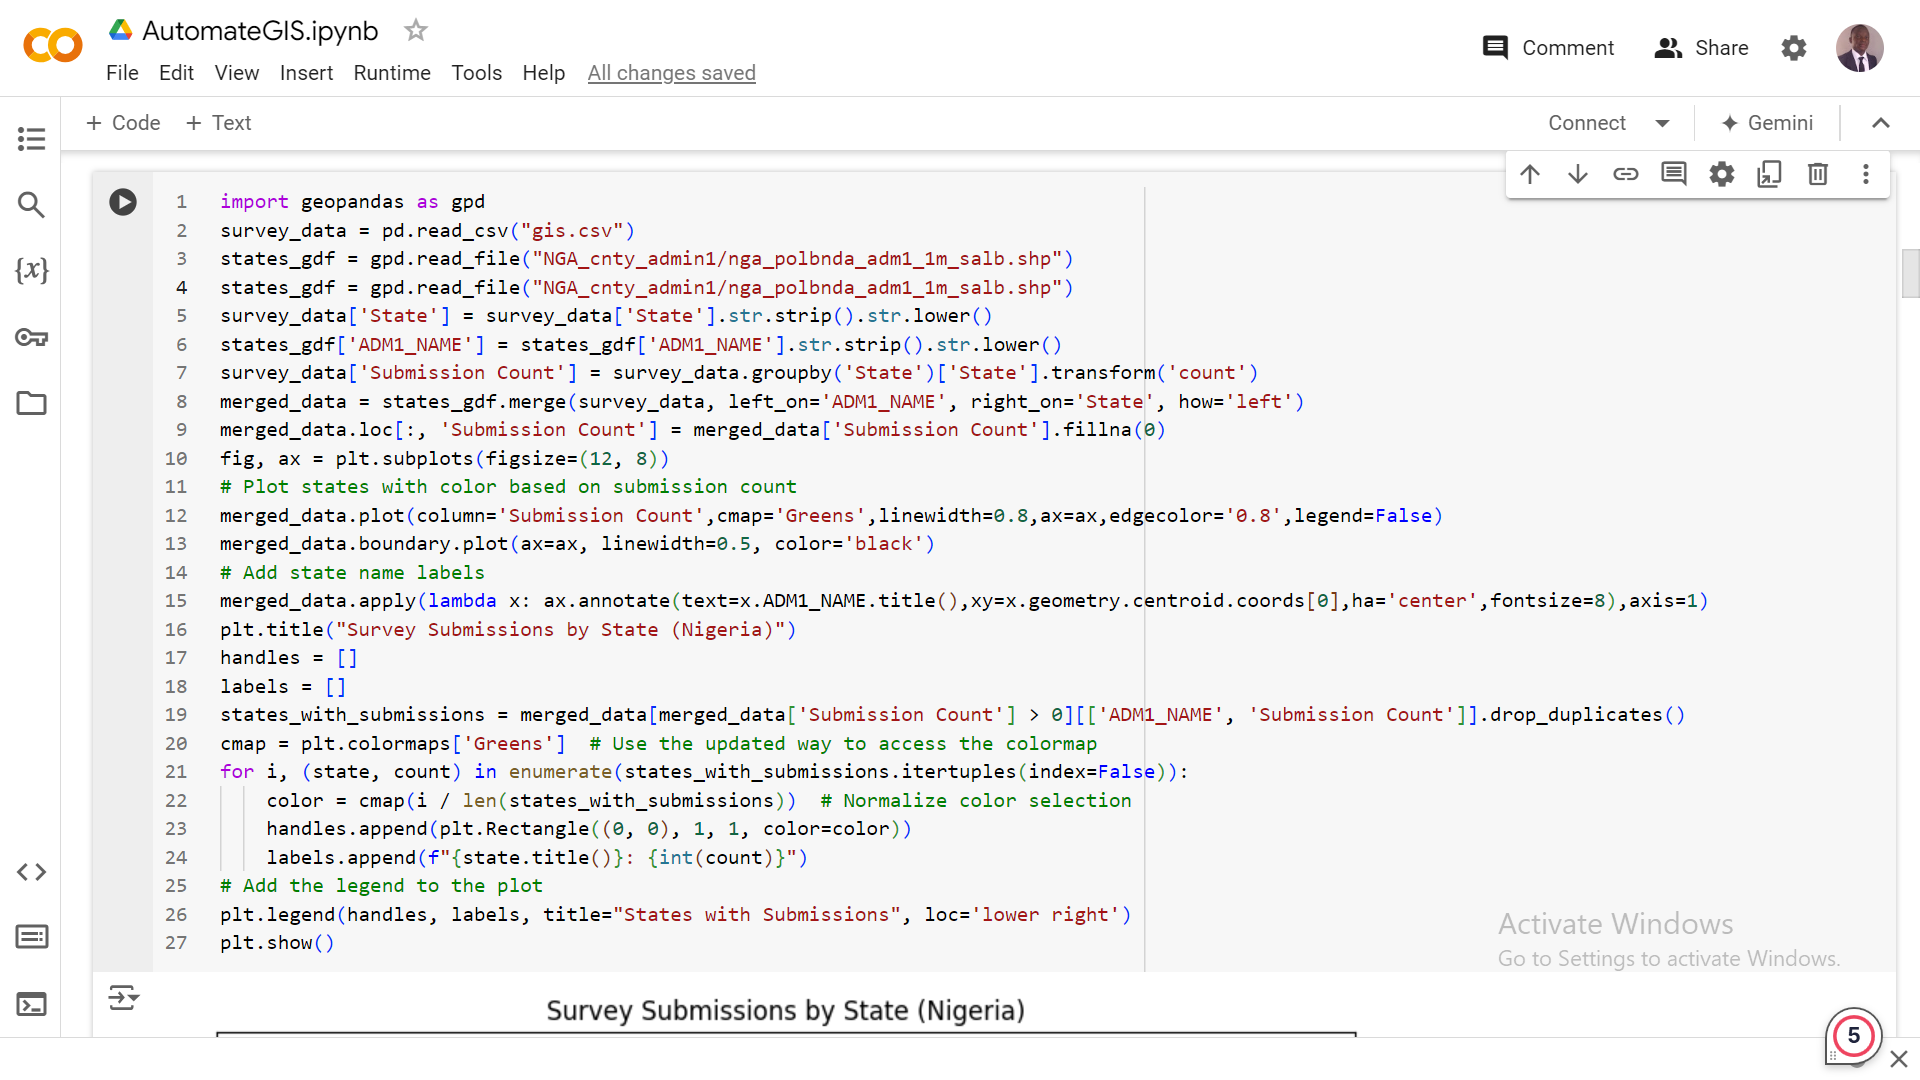
To effectively analyze and visualize geospatial data collected through KoboToolbox, focusing on practical steps and insightful outcomes. Data Collection and Preparation:
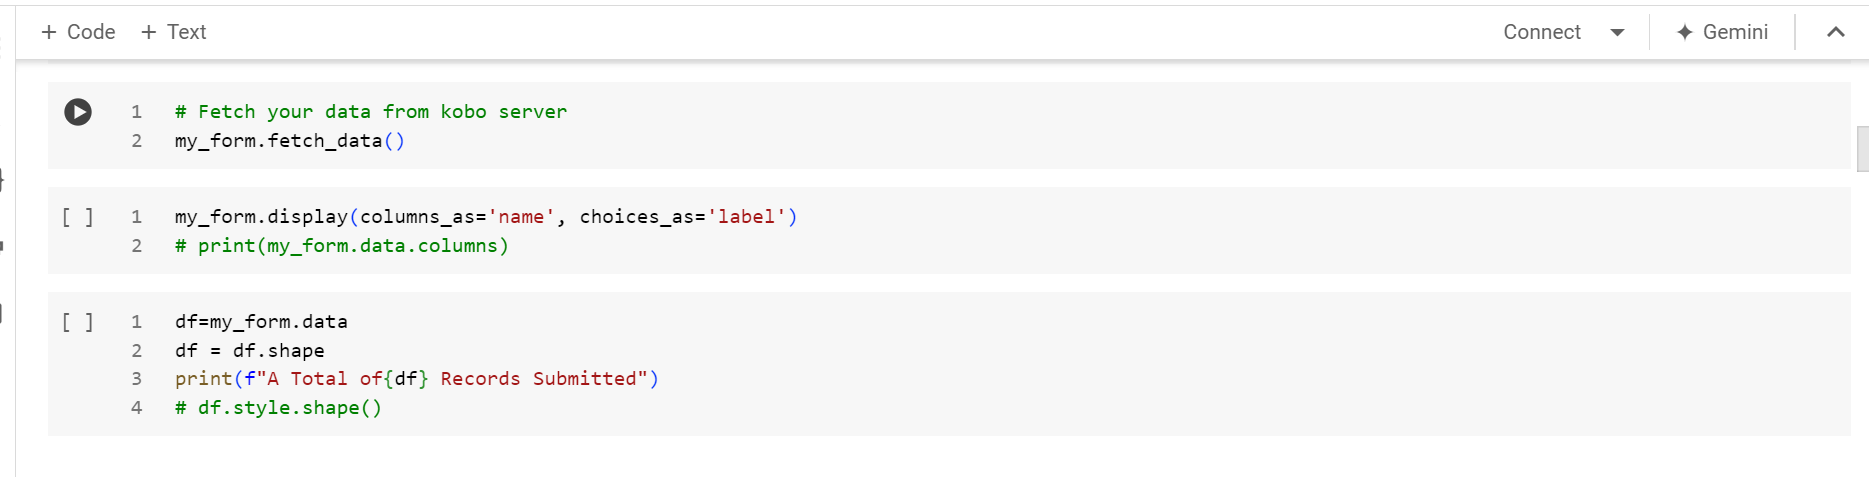
Pykobo facilitated a smooth connection to my KoboToolbox account, allowing me to retrieve the necessary datasets directly into my Colab environment. This integration ensured that data handling and analysis could be executed within a unified workspace.
Geospatial Processing and Visualization: Leveraging GeoPandas: GeoPandas handle the geospatial aspects of my data, enabling operations like creating maps and manipulating geographic coordinates. This library proved vital for transforming raw data into meaningful spatial representations
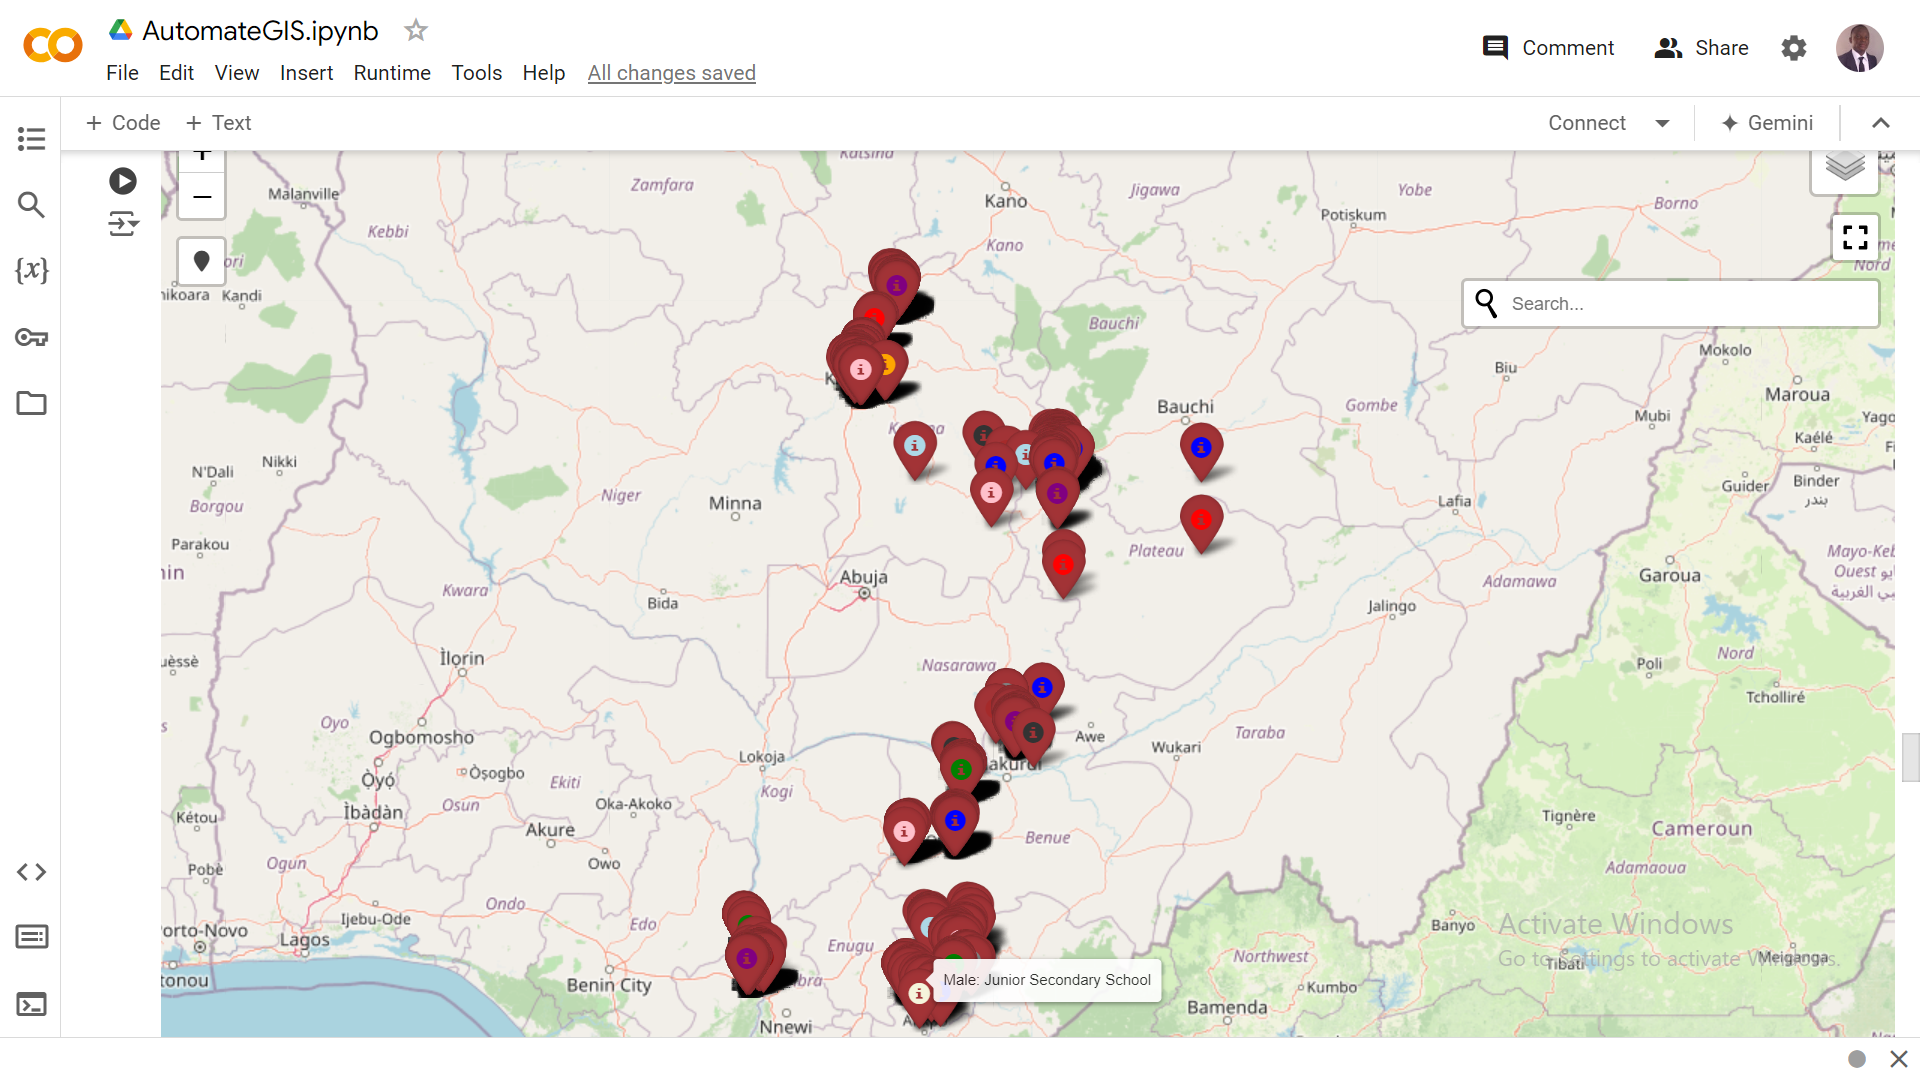
Creating Interactive Maps with Folium: Folium took centre stage in generating interactive maps. I plotted data points onto these maps, enriching them with markers and other visual elements to highlight specific locations and geographic distributions. These interactive maps provided a user-friendly way to explore and understand spatial patterns within the dataset.
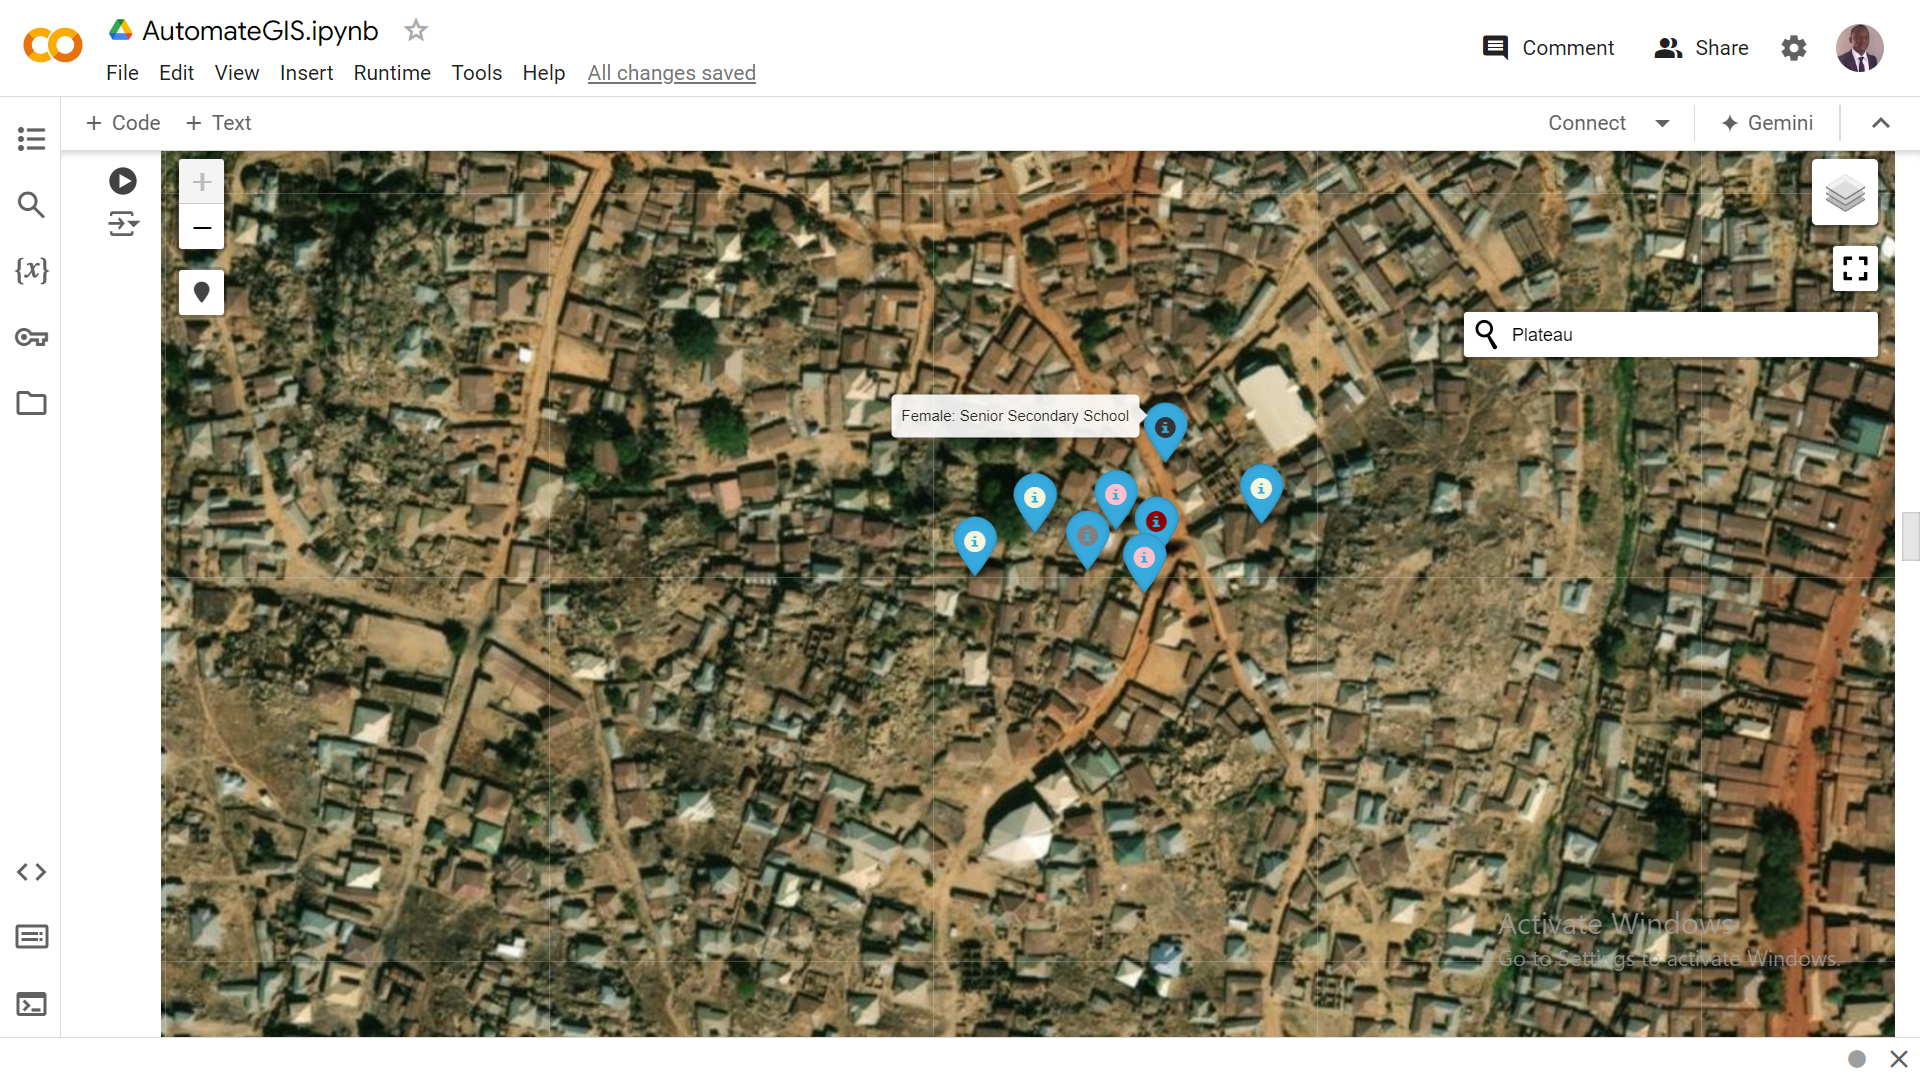
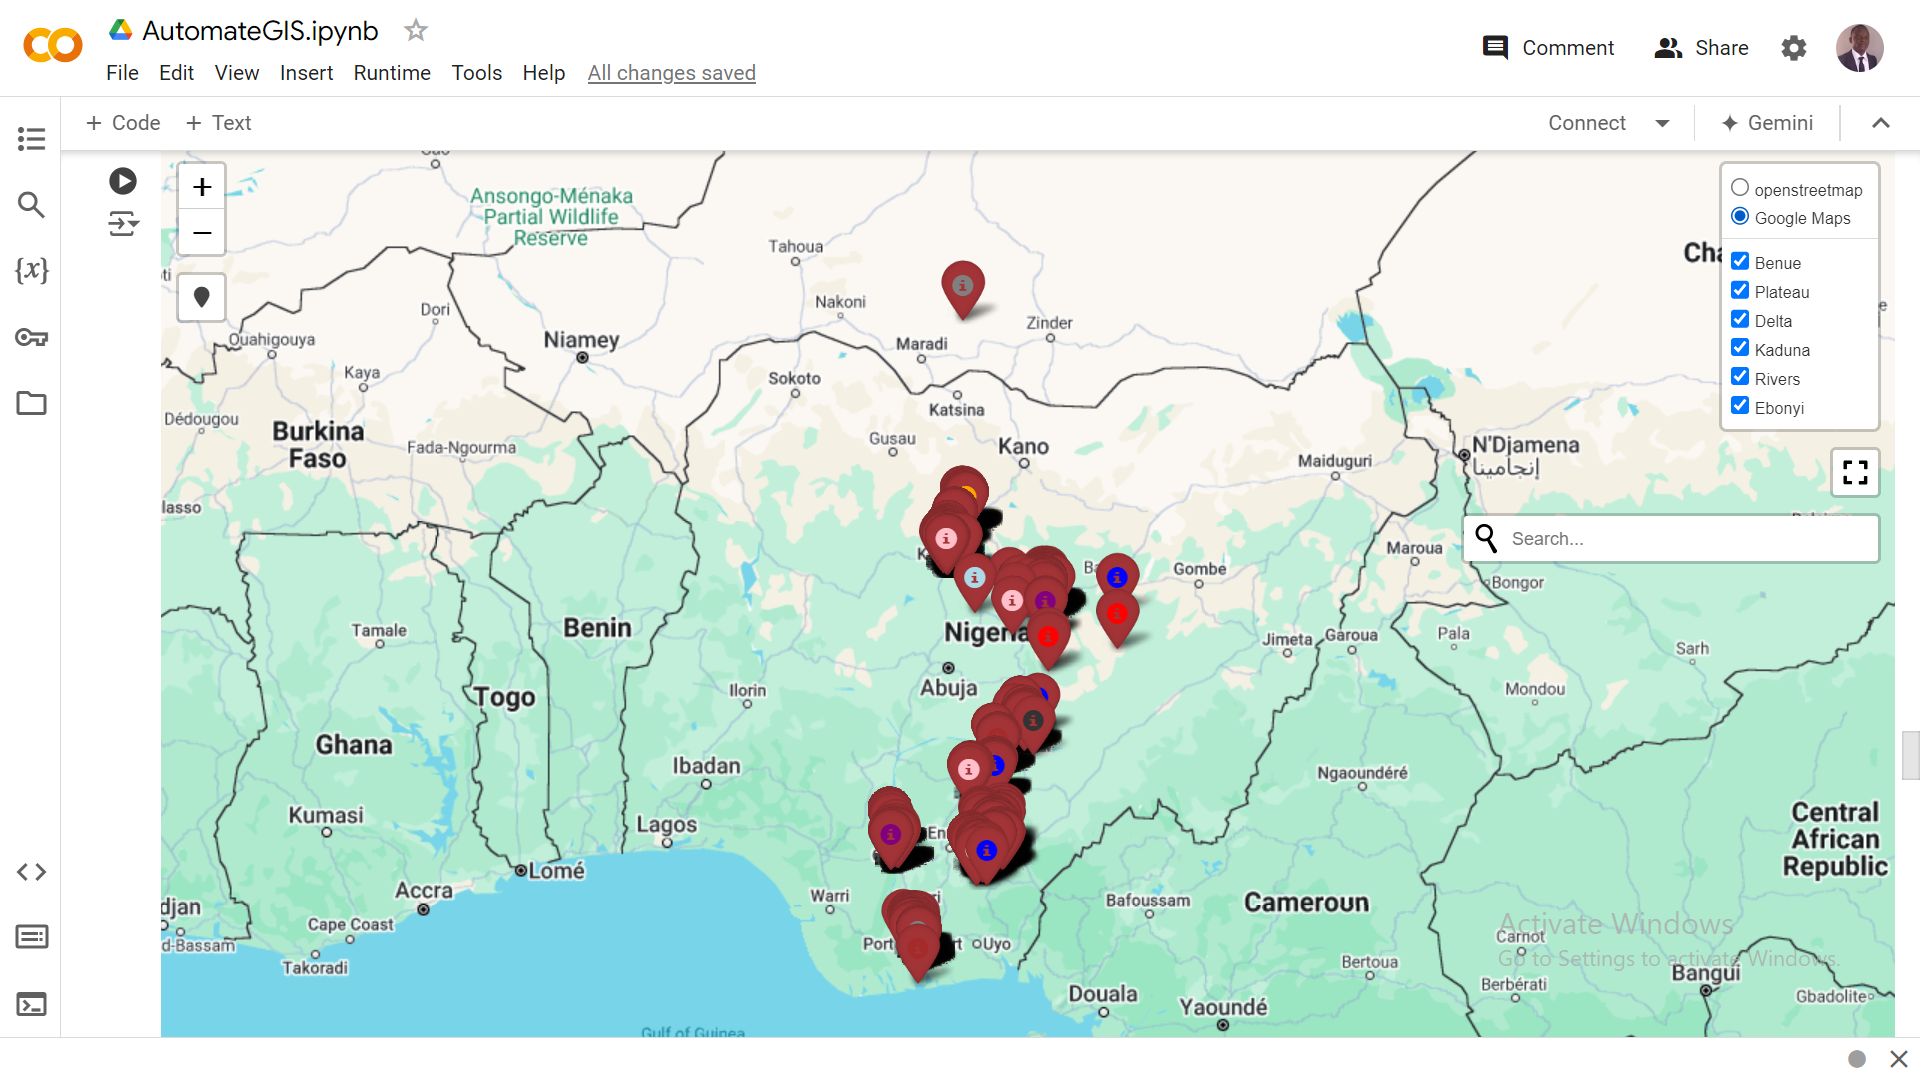
Enhancements and Customization: I incorporated plugins like Fullscreen, Geocoder, and LocateControl into my Folium maps. These additions boosted user experience by offering functionalities such as full-screen viewing, location searching, and user positioning. These seemingly small features contributed significantly to the overall interactivity and usability of the maps. Insights and Observations By employing these tools and techniques, I gained invaluable insights into my geospatial data.
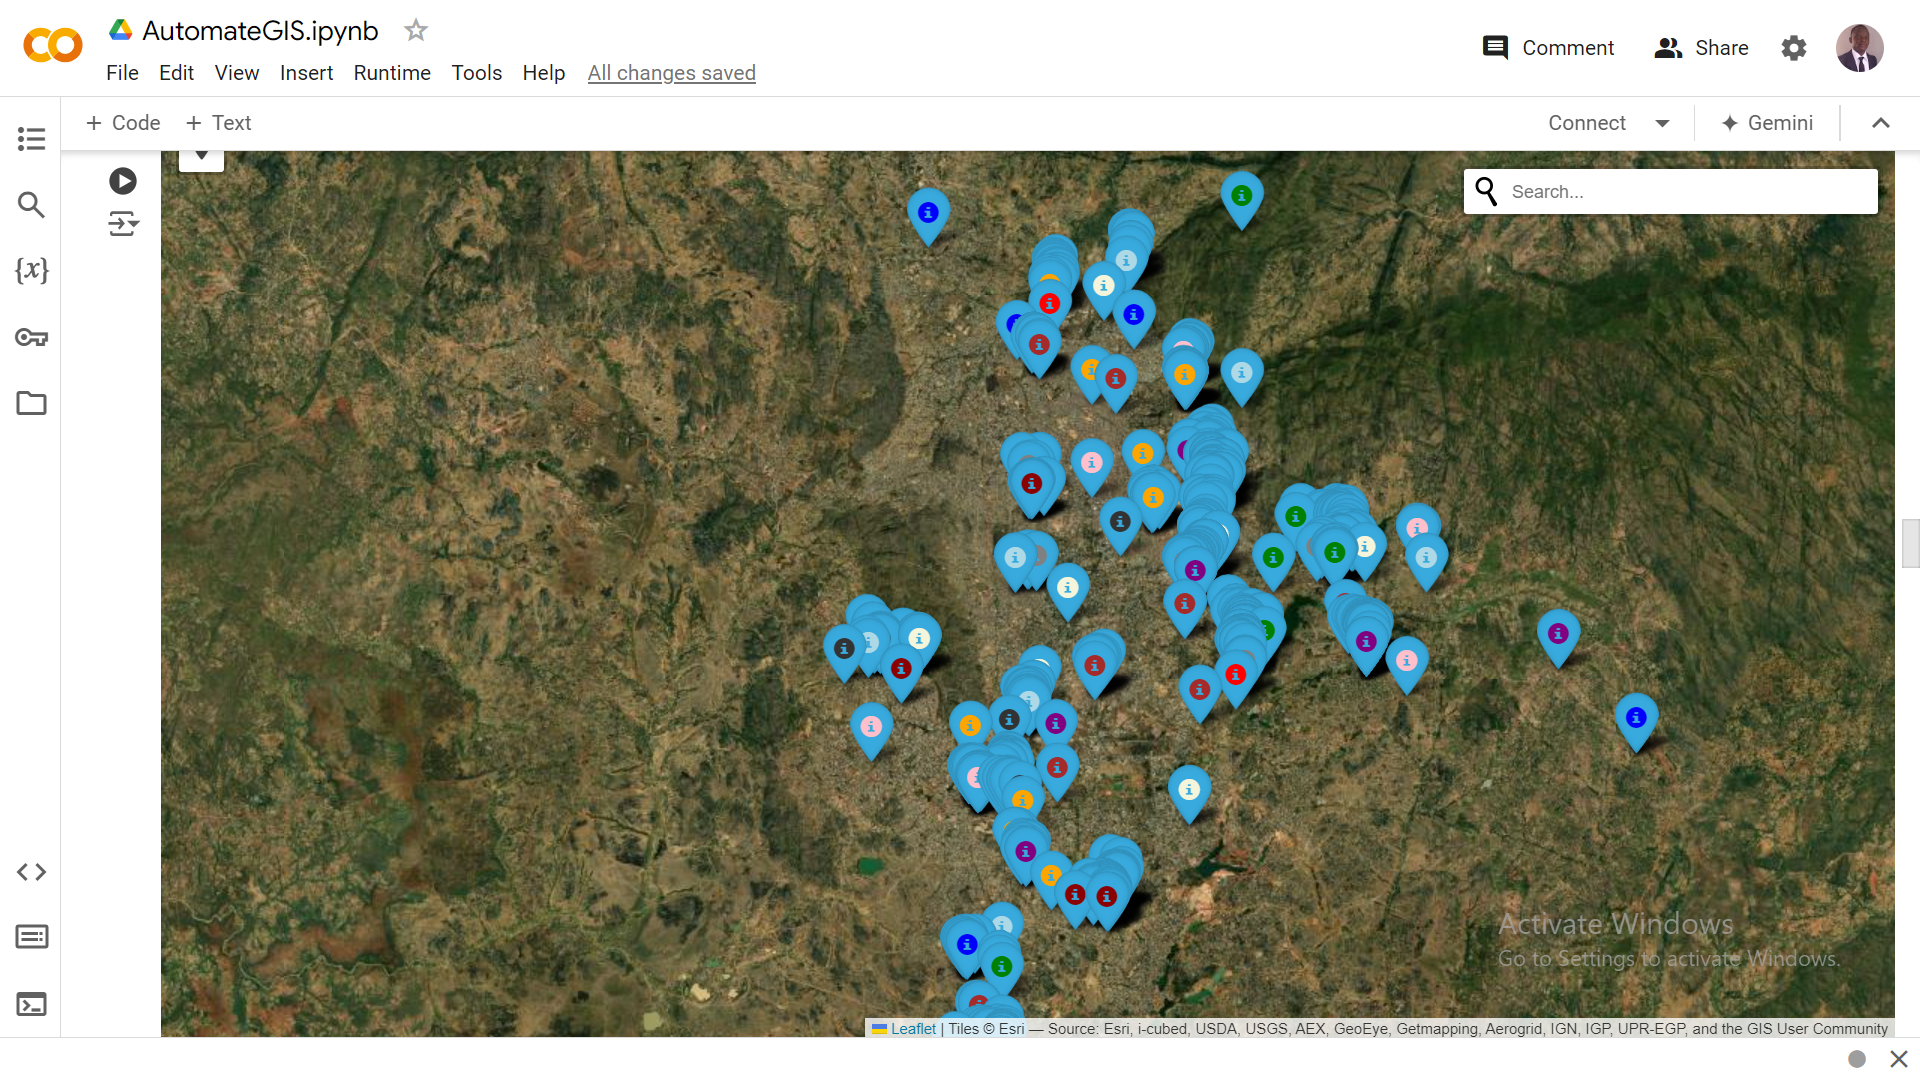
The interactivity of the maps allowed for dynamic data exploration, enabling me to zoom, pan, and click on markers for detailed information about particular data points or regions.
# import folium
# import geopandas
# import pandas as pd
#
# survey_data = pd.read_csv("gis.csv")
# df = survey_data.loc[:, ('State', 'LGA', 'Type of Community ','1. Gender', '2. Level of Education*','Age range', 'Marital Status', 'latitude', 'longitude',)]
#
# # Create point geometries
# geometry = geopandas.points_from_xy(survey_data.longitude, survey_data.latitude)
# geo_df = geopandas.GeoDataFrame(
#     df, geometry=geometry
# )
# def style_function(feature):
#     props = feature.get('properties')
#     markup = f"""
#         <a href="{props.get('url')}">
#             <div style="font-size: 0.8em;">
#             <div style="width: 10px;
#                         height: 10px;
#                         border: 1px solid black;
#                         border-radius: 5px;
#                         background-color: blue;">
#             </div>
#             {props.get('name')}
#         </div>
#         </a>
#     """
#     return {"html": markup}
#
# def map_output():
#
#     # Create a Folium map centered around Nigeria
#     # m = folium.Map(location=[9.0820, 8.6753], zoom_start=6, tiles="Esri WorldImagery")  # Centered around Nigeria
#     m = folium.Map(location=[9.0820, 8.6753], zoom_start=6, tiles="OpenStreetMap")  # Centered around Nigeria
#     # Define marker colors (you can customize these)
#     marker_colors = ["red", "orange", "green", "blue", "purple", "pink",
#                     "brown", "gray", "black", "darkred", "lightblue", "beige"]
#
#     folium.TileLayer(
#     tiles='https://mt1.google.com/vt/lyrs=m&x={x}&y={y}&z={z}',
#     attr='Google',
#     name='Google Maps'
#     ).add_to(m)
#
#     # Add GeoJSON layer for each state with markers for LGAs
#
#     for state in geo_df["State"].unique():
#         state_data = geo_df[geo_df["State"] == state]
#
#         # Create a FeatureGroup for the state
#         fg = folium.FeatureGroup(name=state)
#
#         # Add markers for each LGA within the state
#         for index, row in state_data.iterrows():
#             # Cycle through marker colors
#             color_index = index % len(marker_colors)
#
#              # Create the marker label combining that individual profile
#             label_text = f"{row['1. Gender']}: {row['2. Level of Education*']}"
#
#             folium.Marker(
#                 location=[row["latitude"], row["longitude"]],
#                 popup=folium.Popup(
#                     f"<strong>State:</strong> {row['State']}<br>"
#                     f"<strong>LGA:</strong> {row['LGA']}<br>"
#                     f"<strong>Gender:</strong> {row['1. Gender']}<br>"
#                     f"<strong>Level of Education:</strong> {row['2. Level of Education*']}<br>"
#                     f"<strong>Age Range:</strong> {row['Age range']}<br>"
#                     f"<strong>Marital Status:</strong> {row['Marital Status']}"
#
#
#                 ),
#                 icon=folium.Icon(color='darkred', icon_color=marker_colors[color_index], icon="info-sign"), tooltip=label_text
#             ).add_to(fg)
#         # Add the FeatureGroup to the map
#             fg.add_to(m)
#     # Add map controls
#     # folium.plugins.Draw(export=True).add_to(m)
#     folium.LayerControl().add_to(m)
#     folium.LatLngPopup().add_to(m)
#     folium.plugins.Fullscreen(
#         position="topright",
#         title="Expand me",
#         title_cancel="Exit me",
#         force_separate_button=True,
#     ).add_to(m)
#
#     # Correct TagFilterButton usage (assuming 'State' is the property to filter by)
#     # TagFilterButton('state_name').add_to(m)
#
#     folium.plugins.Geocoder().add_to(m)
#     folium.plugins.LocateControl(auto_start=False).add_to(m)
#     return m
#
# map_output()
Conclusion: The fusion of Google Colab, KoboToolbox, GeoPandas, and Folium empowered me to conduct comprehensive geospatial data analysis. This integration not only streamlined the process but also fostered a deeper understanding of spatial patterns and relationships.